Fig. A.6.
Download original image
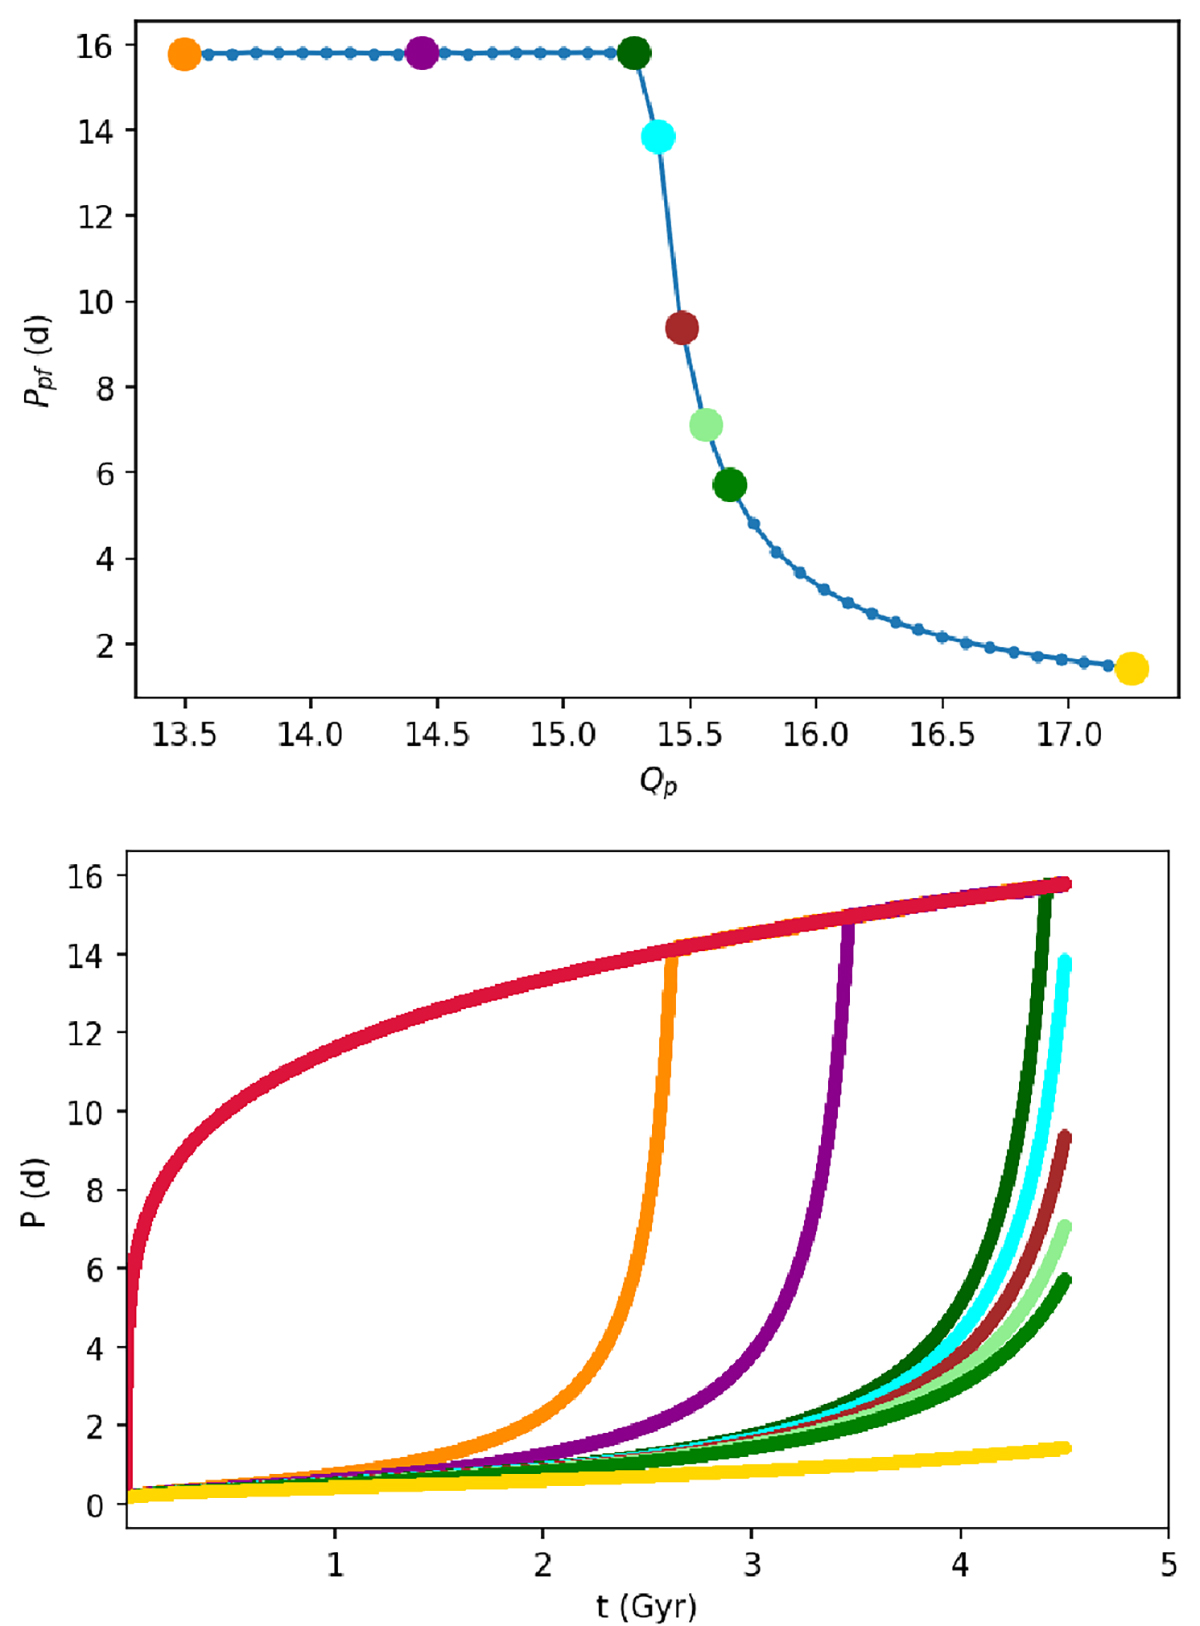
Demonstration of the sensitivity of the model to the Qp parameter. Top panel: The final rotation period vs. Qp parameter. Each dot in this plot corresponds to the Qp and the final Eris rotation period, Ppf, of a specific run. All other model parameters were kept the same. Bottom panel: Evolution of the rotation period of Eris, using the models presented in the upper panel. The colours of the curves correspond to the colour of the symbols on the upper panel, the red curve is the evolution of the orbital period.
Current usage metrics show cumulative count of Article Views (full-text article views including HTML views, PDF and ePub downloads, according to the available data) and Abstracts Views on Vision4Press platform.
Data correspond to usage on the plateform after 2015. The current usage metrics is available 48-96 hours after online publication and is updated daily on week days.
Initial download of the metrics may take a while.