Fig. 9
Download original image
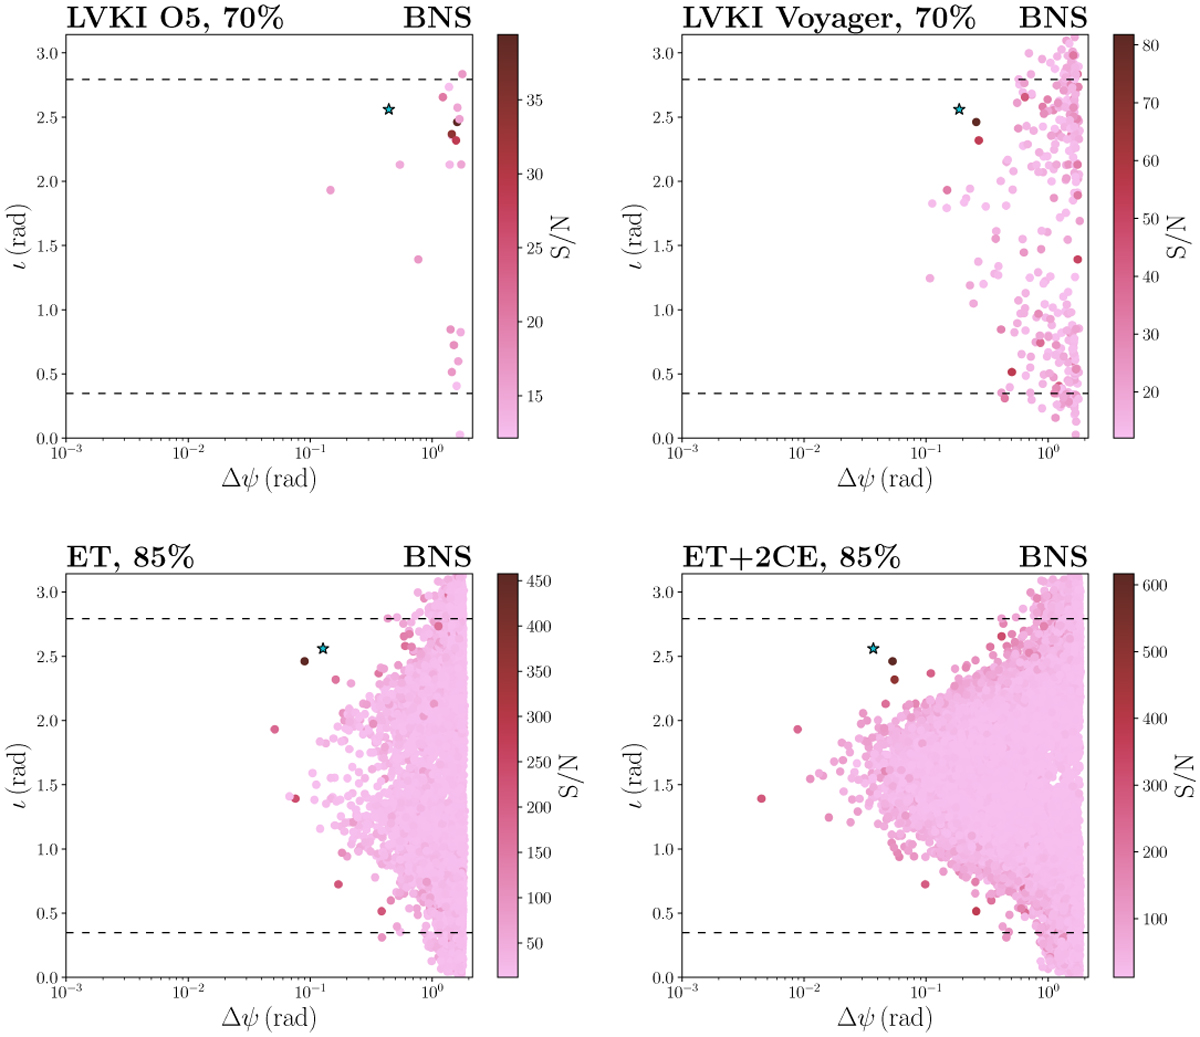
Scatter plots of the observed BNS population in one year at various detector networks. On the first row we report the results for the current network of detectors, namely LIGO, Virgo and KAGRA, plus LIGO India both during the O5 run (left panel) and in the Voyager stage for the LIGO detectors (right panel). In the bottom row we instead report the results for 3G detectors, both for ET alone (left panel) and a network consisting of ET and two CE detectors (right panel). In each panel we report the observed errors on the polarization angle ψ as a function of the inclination angle ι, with a color code that gives information on the S/N. The dashed lines in each panel mark ι = 20° and ι = 160°, to give an hint of the regions where a beamed counterpart is observable. The percentages in the titles refer to the assumed (independent) duty cycle of each detector in the considered network configuration. For reference, we report the estimated values for the GW170817-like event described in the text as a blue star.
Current usage metrics show cumulative count of Article Views (full-text article views including HTML views, PDF and ePub downloads, according to the available data) and Abstracts Views on Vision4Press platform.
Data correspond to usage on the plateform after 2015. The current usage metrics is available 48-96 hours after online publication and is updated daily on week days.
Initial download of the metrics may take a while.