Fig. 6
Download original image
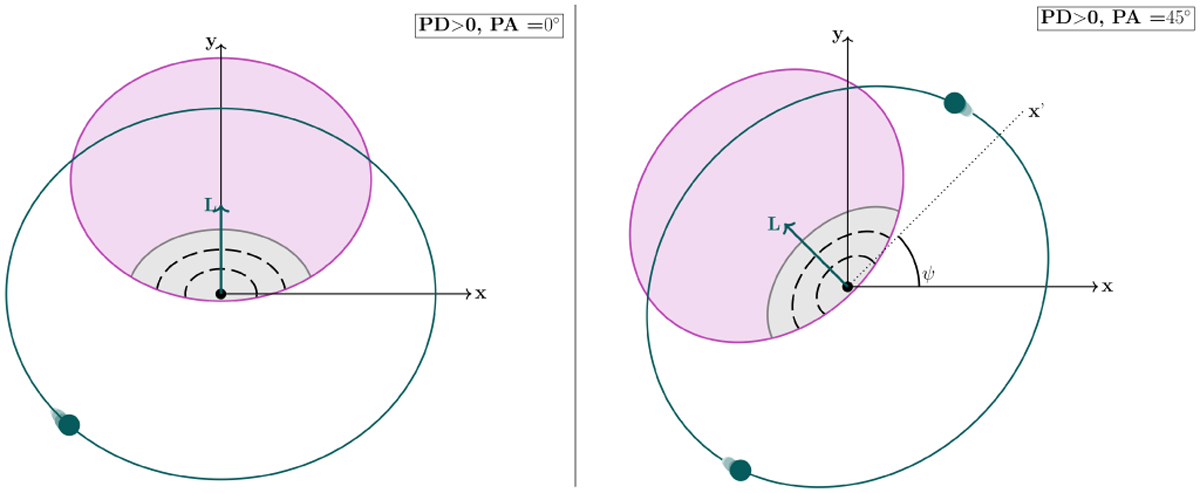
Illustration of the correlation between ψ and PA for photospheric emission models. Left: illustration of the photospheric emission when observing the GRB with ι > 0° and ψ = 0°. The observed area with a size of 1/Γ is in gray and is no longer fully contained in the beam allowing for PD > 0. The polarization of the remaining emission areas no longer cancels out, and the PA is aligned with ψ. Right: the same as left but now with ψ = 45° resulting in a PA of 45°.
Current usage metrics show cumulative count of Article Views (full-text article views including HTML views, PDF and ePub downloads, according to the available data) and Abstracts Views on Vision4Press platform.
Data correspond to usage on the plateform after 2015. The current usage metrics is available 48-96 hours after online publication and is updated daily on week days.
Initial download of the metrics may take a while.