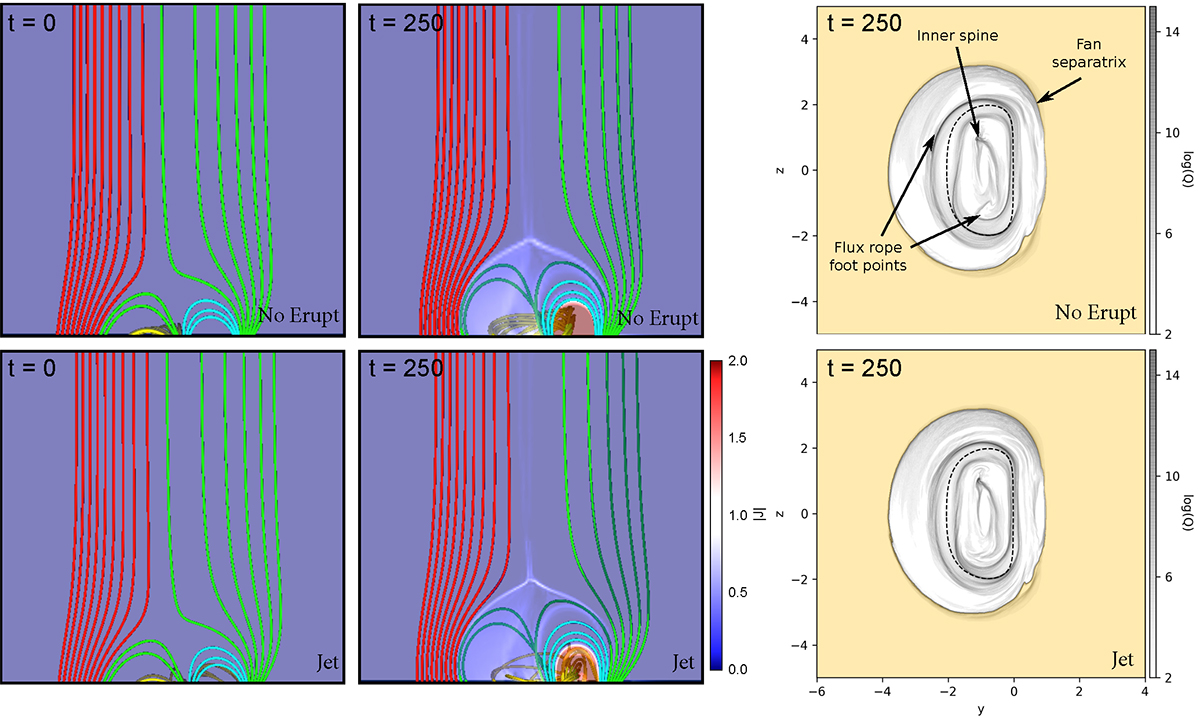
Fig. 1.
Download original image
Snapshots of the common initial phase (0 < t < 250) of both simulations. Left panels: electric current density distribution in a central 2D cut and magnetic field lines. Right: QSL distribution at t = 250. The dashed line shows the PIL. Top panels: non-eruptive case. Bottom panels: jet-producing case. Yellow shading indicates the open field.
Current usage metrics show cumulative count of Article Views (full-text article views including HTML views, PDF and ePub downloads, according to the available data) and Abstracts Views on Vision4Press platform.
Data correspond to usage on the plateform after 2015. The current usage metrics is available 48-96 hours after online publication and is updated daily on week days.
Initial download of the metrics may take a while.