Fig. B.1
Download original image
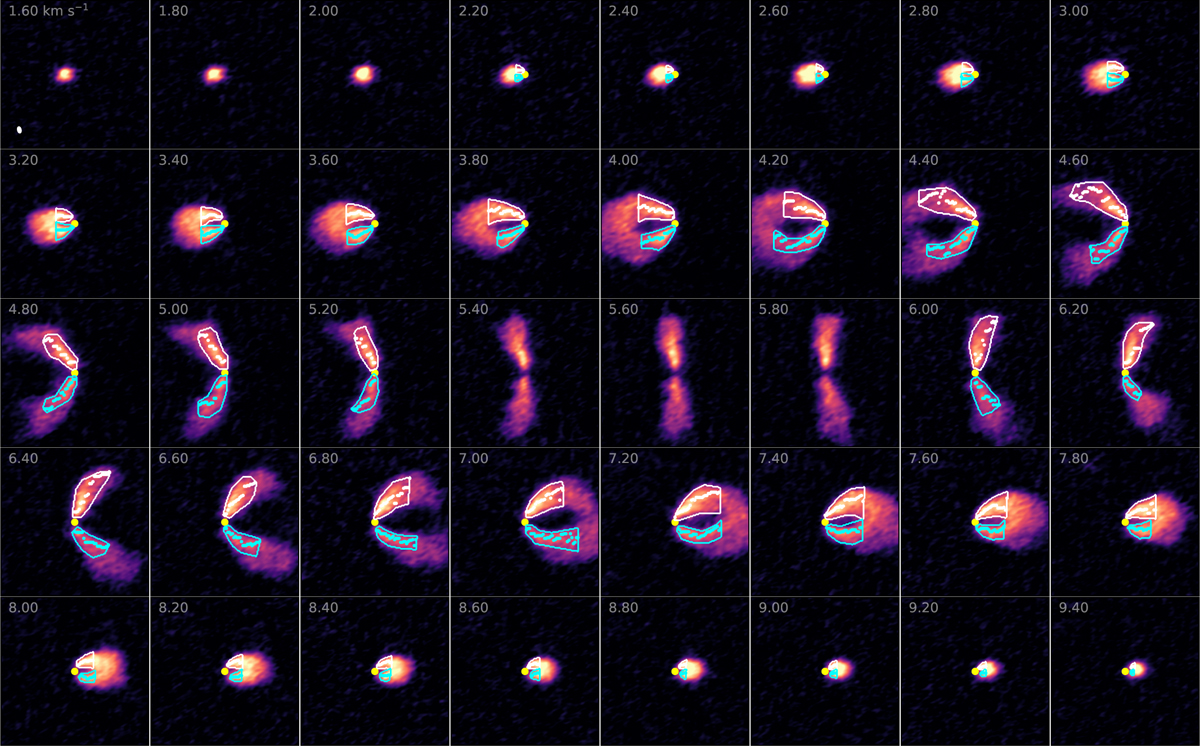
12CO channel maps of HD 100546. The white and blue lines show the outlines of the hand-drawn masks of the far sides and the nearside, respectively. The white and blue scatter show the corresponding extracted points. The yellow circle denotes the position of the star. To make the fainter parts more visible, a power-law normalization was used. On each panel, the channel velocity in km s−1 is indicated in the top-left corner. The beam size is shown in the bottom-left corner of the first panel.
Current usage metrics show cumulative count of Article Views (full-text article views including HTML views, PDF and ePub downloads, according to the available data) and Abstracts Views on Vision4Press platform.
Data correspond to usage on the plateform after 2015. The current usage metrics is available 48-96 hours after online publication and is updated daily on week days.
Initial download of the metrics may take a while.