Fig. 2
Download original image
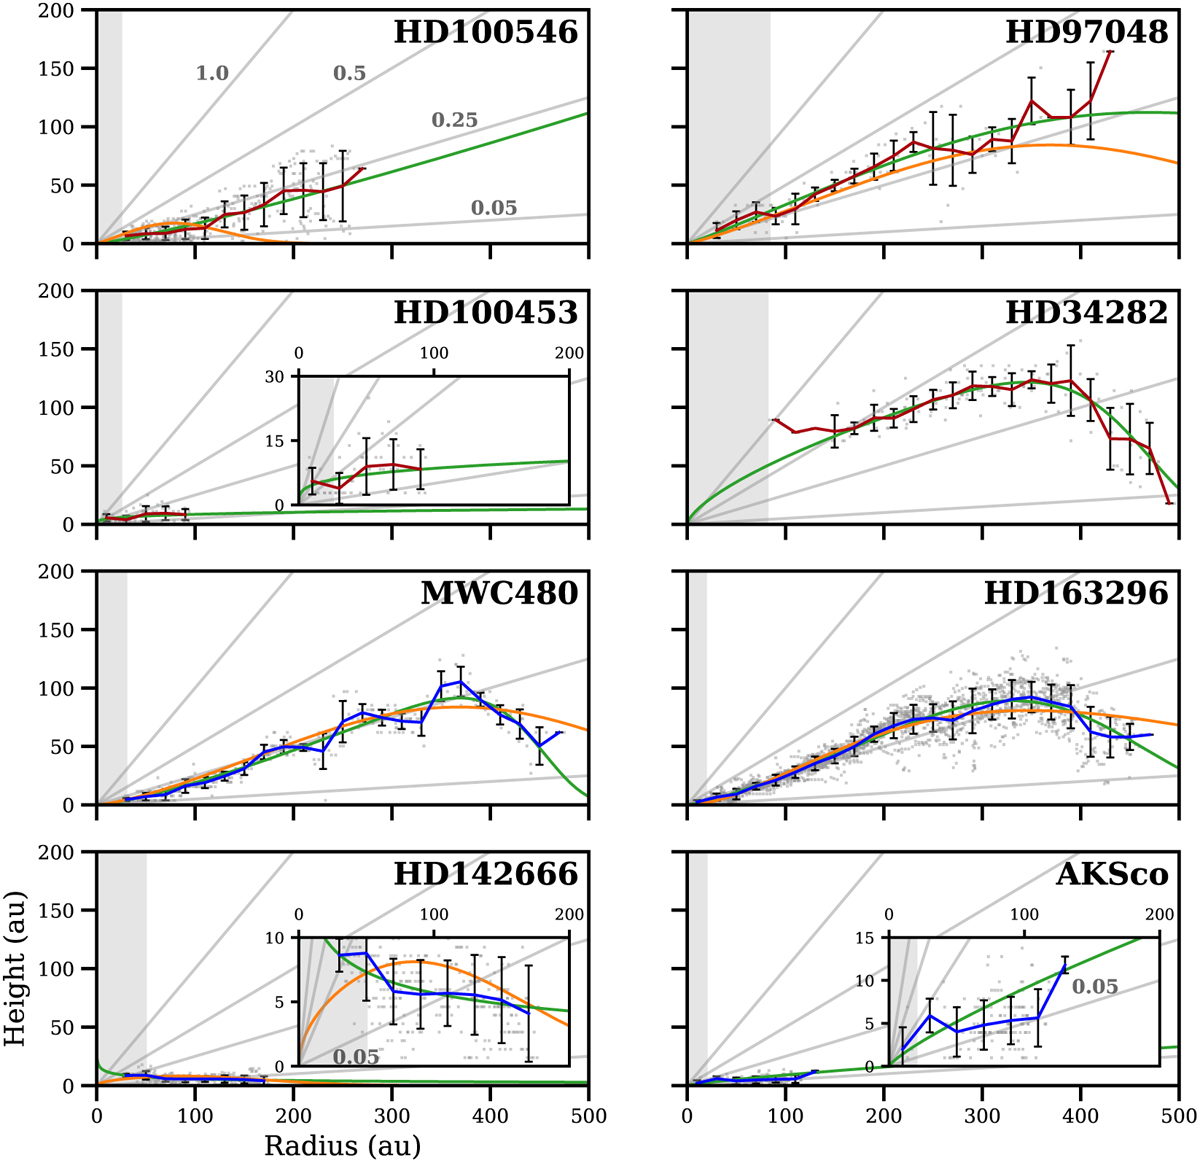
Height profiles of the group I disks (top four panels) and group II disks (bottom four panels). The gray lines indicate the 1.0, 0.5, 0.25, and 0.05 height to radius ratios. The gray scatter is the extracted points from the channel maps, and the line shows the mean value of the scatter in bins of 20 au in size. The error bars indicate the standard deviation of the scatter in each bin. The fitted profiles are shown as green lines and are compared to the orange profiles from Law et al. (2021) for HD 163296 and MWC 480, Law et al. (2022) for HD 142666 and HD 100546, and Rich et al. (2021) for HD 97048. The gray-shaded regions indicate the size of the major axis of the beam.
Current usage metrics show cumulative count of Article Views (full-text article views including HTML views, PDF and ePub downloads, according to the available data) and Abstracts Views on Vision4Press platform.
Data correspond to usage on the plateform after 2015. The current usage metrics is available 48-96 hours after online publication and is updated daily on week days.
Initial download of the metrics may take a while.