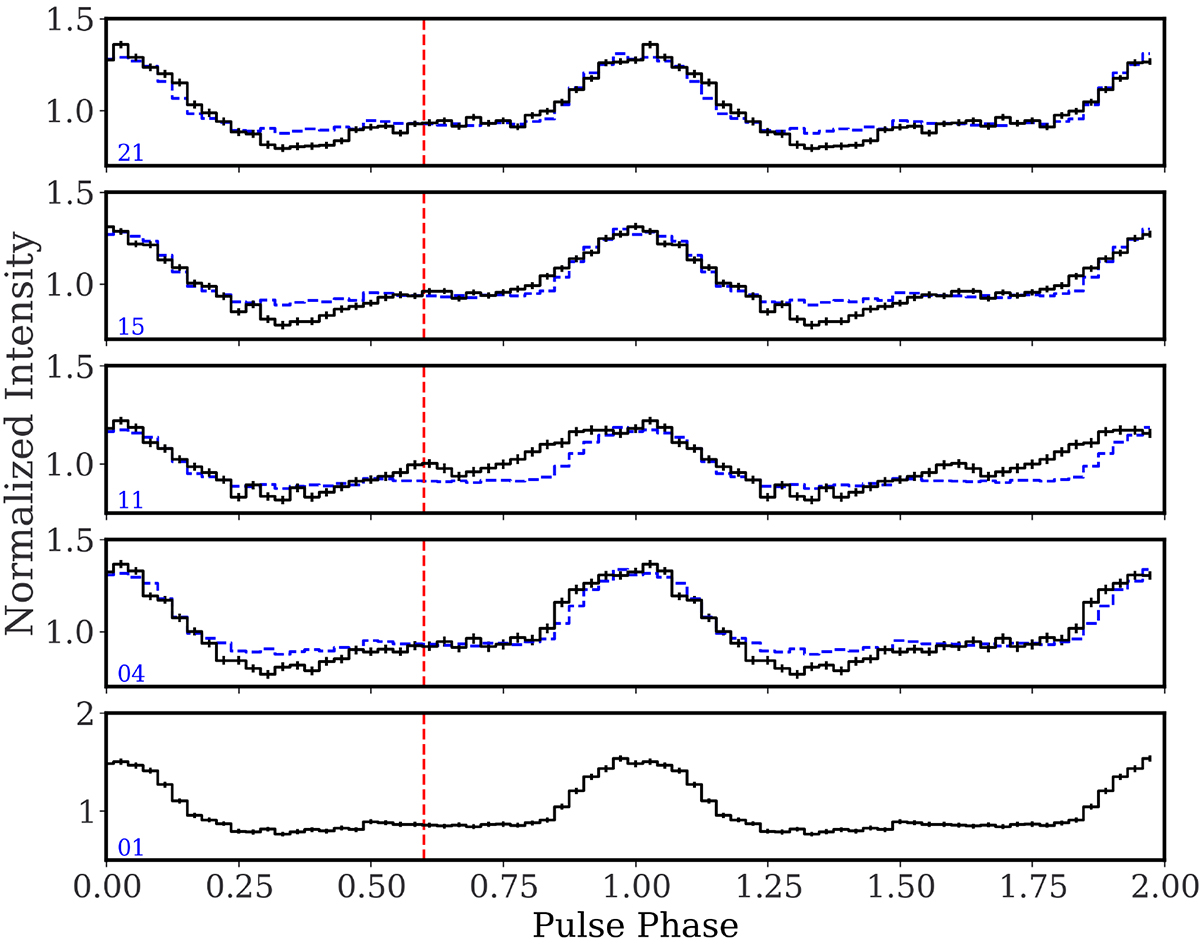
Fig. 6.
Download original image
Selection of representative NICER pulse profiles. The labels on the bottom left corner of each panel represent the correspondent ObsID. The red dashed vertical line marks the secondary peak that is more relevant in ObsID 11 at ϕ = 0.6 (see also Fig. 5). The blue dashed line shows the pulse profile from ObsID 01 rescaled for reference. Pulse profiles are plotted twice for clarity and normalized by the average source intensity in a given ObsID.
Current usage metrics show cumulative count of Article Views (full-text article views including HTML views, PDF and ePub downloads, according to the available data) and Abstracts Views on Vision4Press platform.
Data correspond to usage on the plateform after 2015. The current usage metrics is available 48-96 hours after online publication and is updated daily on week days.
Initial download of the metrics may take a while.