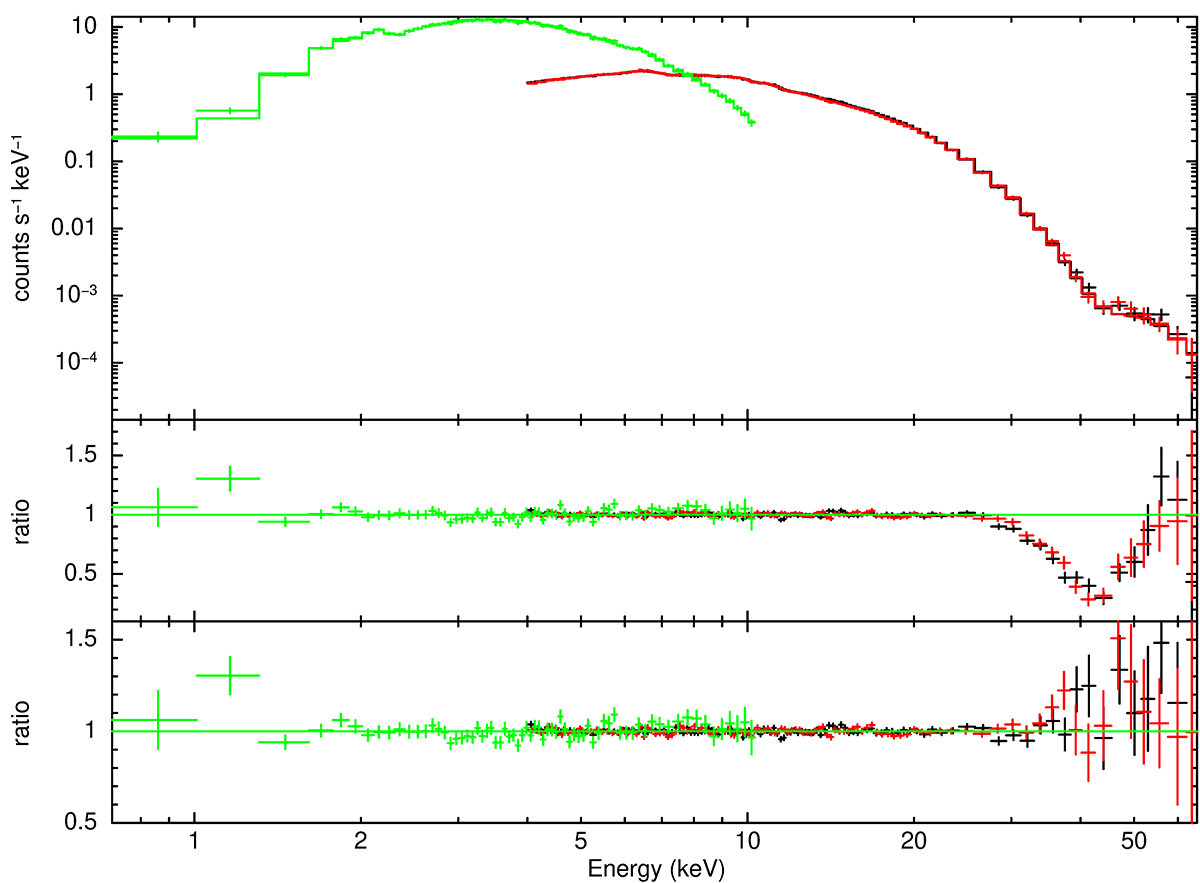
Fig. 2.
Download original image
NICER (green) and NuSTAR (black and red) combined spectrum of GRO J1750-27. Top panel: data (crosses) and best-fit model (continuous lines). Middle: Ratio residuals (data divided by model) using Model I Smooth (see Table 2) but without the inclusion of a cyclotron line. Bottom: residuals from the best-fit model including a Gaussian absorption line near 43 keV to account for the cyclotron resonant scattering feature. Data were rebinned for plotting purposes.
Current usage metrics show cumulative count of Article Views (full-text article views including HTML views, PDF and ePub downloads, according to the available data) and Abstracts Views on Vision4Press platform.
Data correspond to usage on the plateform after 2015. The current usage metrics is available 48-96 hours after online publication and is updated daily on week days.
Initial download of the metrics may take a while.