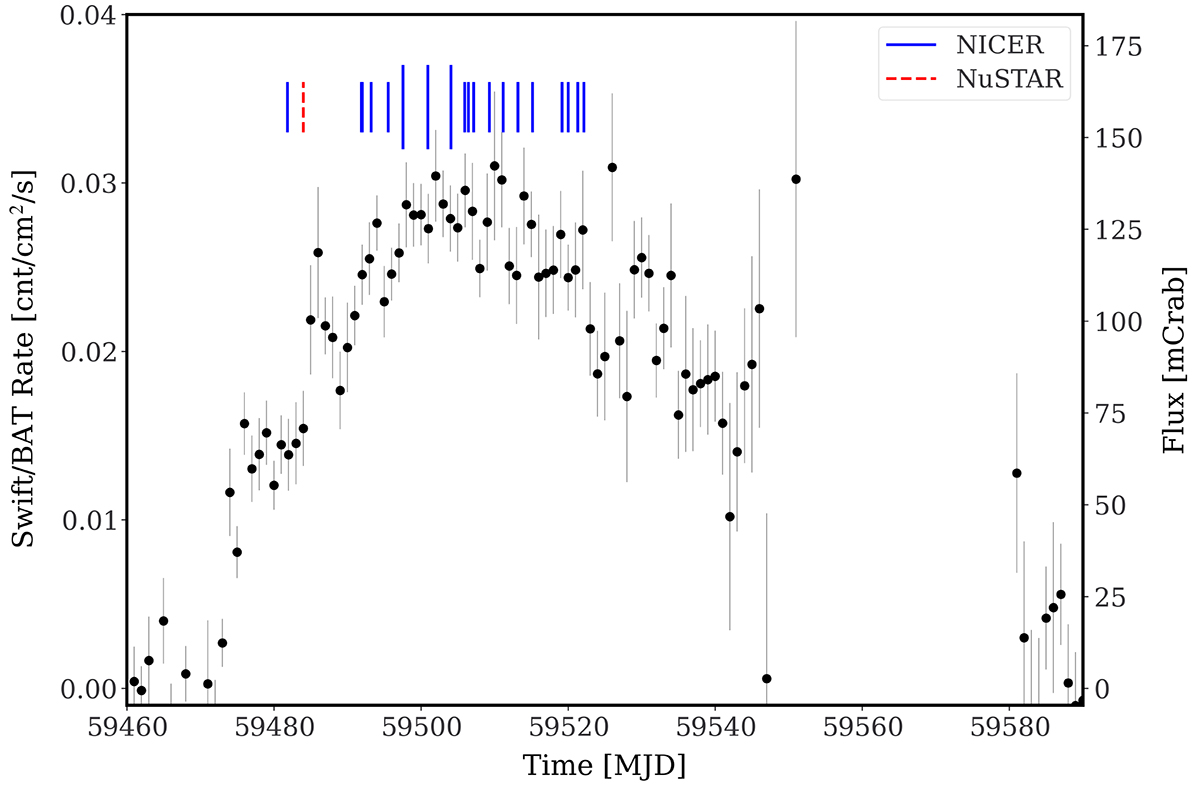
Fig. 1.
Download original image
Swift/BAT (15–50 keV) daily average light curve of GRO J1750-27 during the outburst in 2021 (black dots with gray error bars). Start times of each pointed observation are marked by vertical colored lines as detailed in the legend. NICER ObsIDs showing evidence of a secondary peak in the pulse profile (see text) are marked with a longer line.
Current usage metrics show cumulative count of Article Views (full-text article views including HTML views, PDF and ePub downloads, according to the available data) and Abstracts Views on Vision4Press platform.
Data correspond to usage on the plateform after 2015. The current usage metrics is available 48-96 hours after online publication and is updated daily on week days.
Initial download of the metrics may take a while.