Fig. 4.
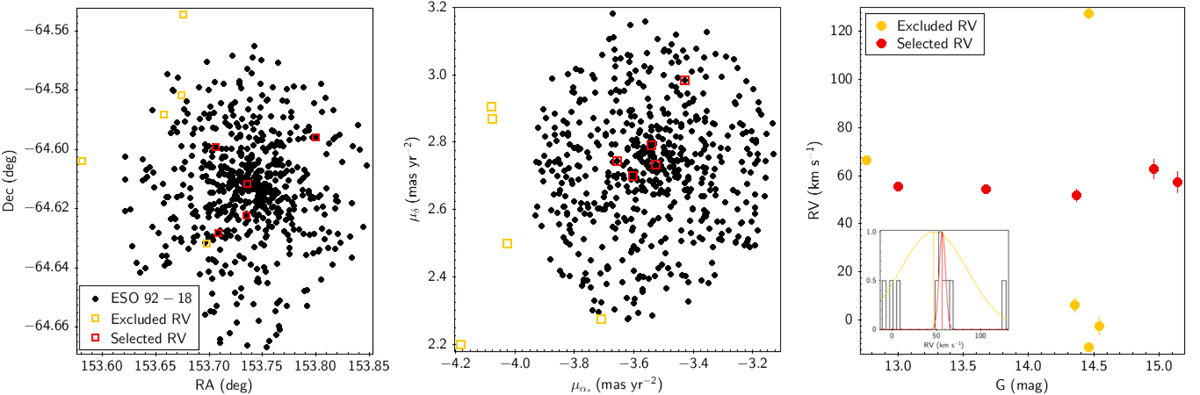
Download original image
Selection RVs. We take the cluster named ESO 92-18 as representative, as it is in the direction of this cluster that we identified the highest number of stars with RVs. We show the position (left panel) and PM (in the middle) diagrams for the PM-selected ESO 92-18 stars (black points) and for stars with RVs. We also display the RV versus G-magnitude diagram (right panel), where we show selected RV values for those stars that are likely members of the cluster (red points) and those excluded because they show a very different RV with respect to the RV cluster mean. In the insert, we plot the normalised histogram for the sample, and we over-plot the Gaussian fit for the whole sample (yellow line) and for the selected stars (red line), showing how both means and standard deviations change in the two cases.
Current usage metrics show cumulative count of Article Views (full-text article views including HTML views, PDF and ePub downloads, according to the available data) and Abstracts Views on Vision4Press platform.
Data correspond to usage on the plateform after 2015. The current usage metrics is available 48-96 hours after online publication and is updated daily on week days.
Initial download of the metrics may take a while.