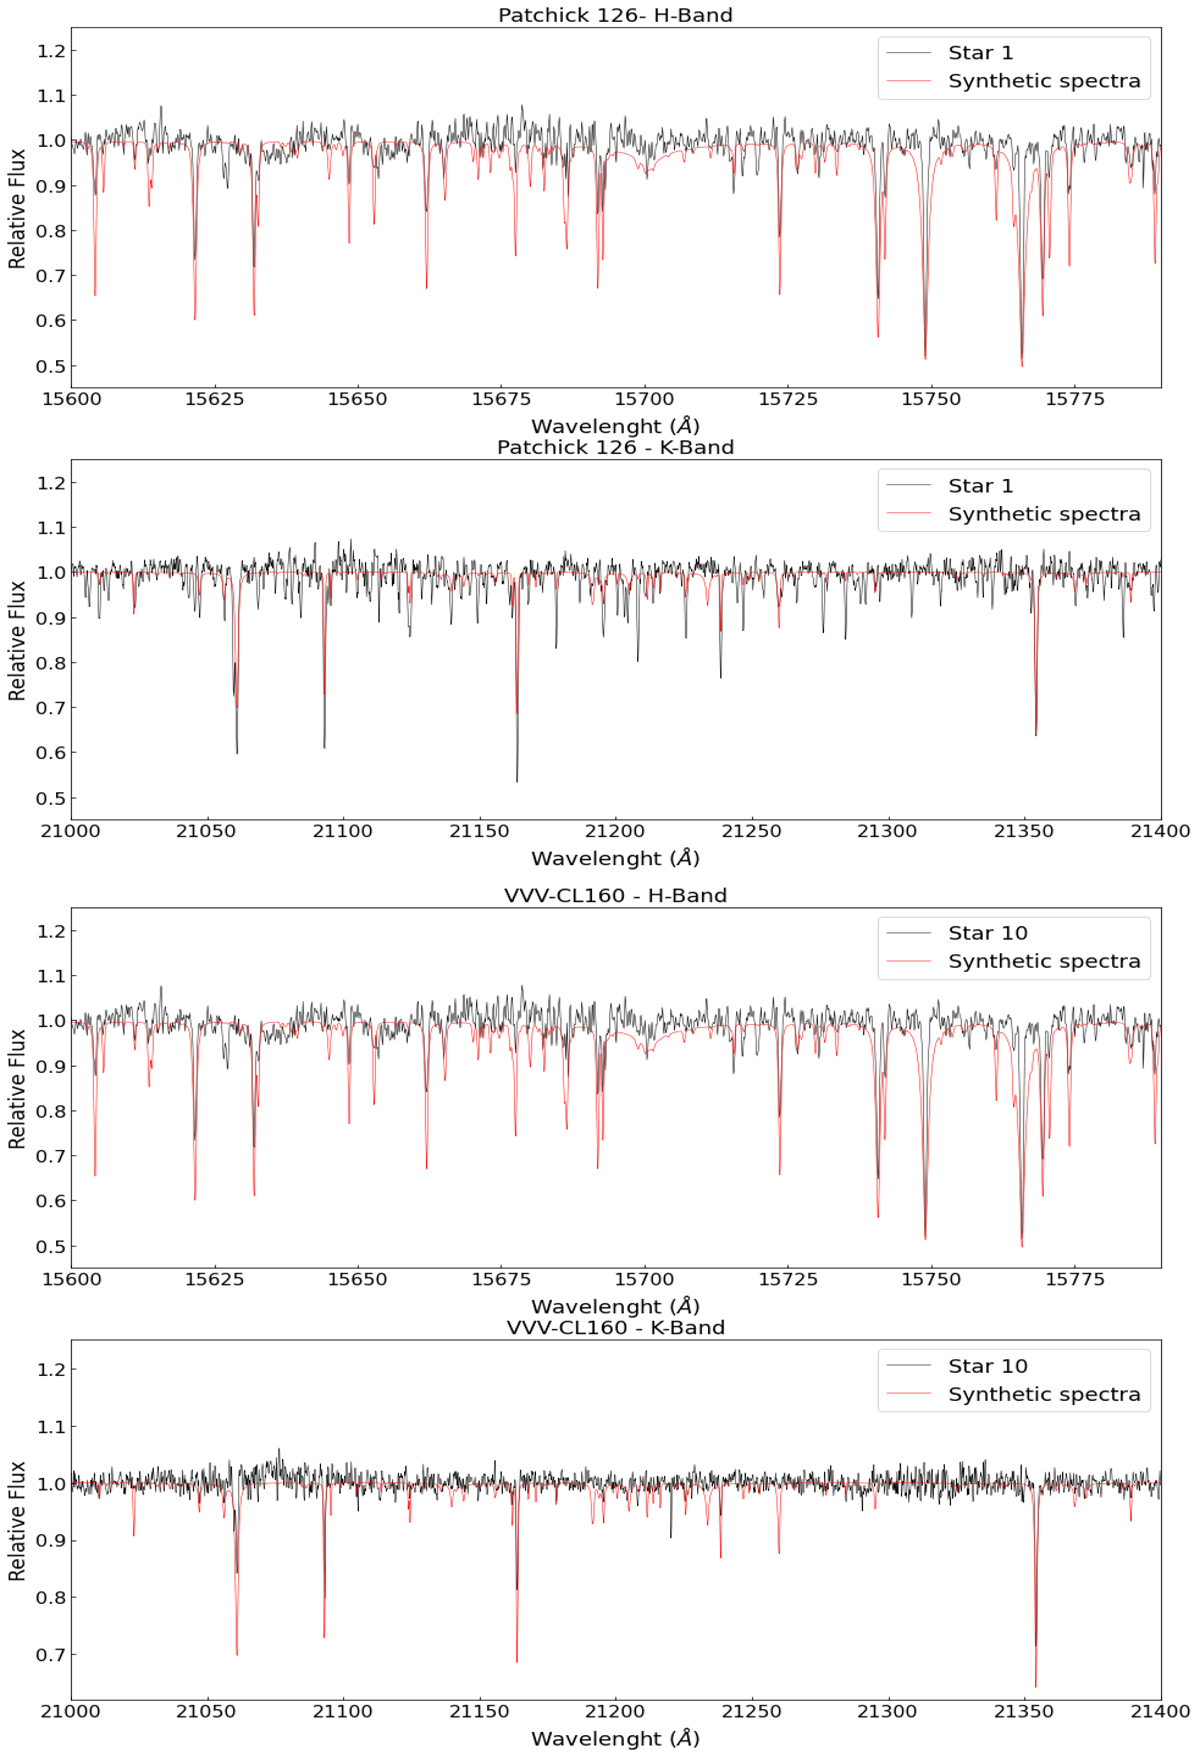
Fig. 3.
Download original image
Cross-correlation. Representative IGRINS H- and K-band spectra of two RGB stars: Star 1 for Patchick 126 and Star 10 for VVV-CL160 (black lines). We superimposed the synthetic solar spectra (red lines) used for determination of cross-correlation velocities in the spectral regions between 15 000 and 17 000 Å in the H-band, and between 19 500 and 22 900 Å in the K-band.
Current usage metrics show cumulative count of Article Views (full-text article views including HTML views, PDF and ePub downloads, according to the available data) and Abstracts Views on Vision4Press platform.
Data correspond to usage on the plateform after 2015. The current usage metrics is available 48-96 hours after online publication and is updated daily on week days.
Initial download of the metrics may take a while.