Open Access
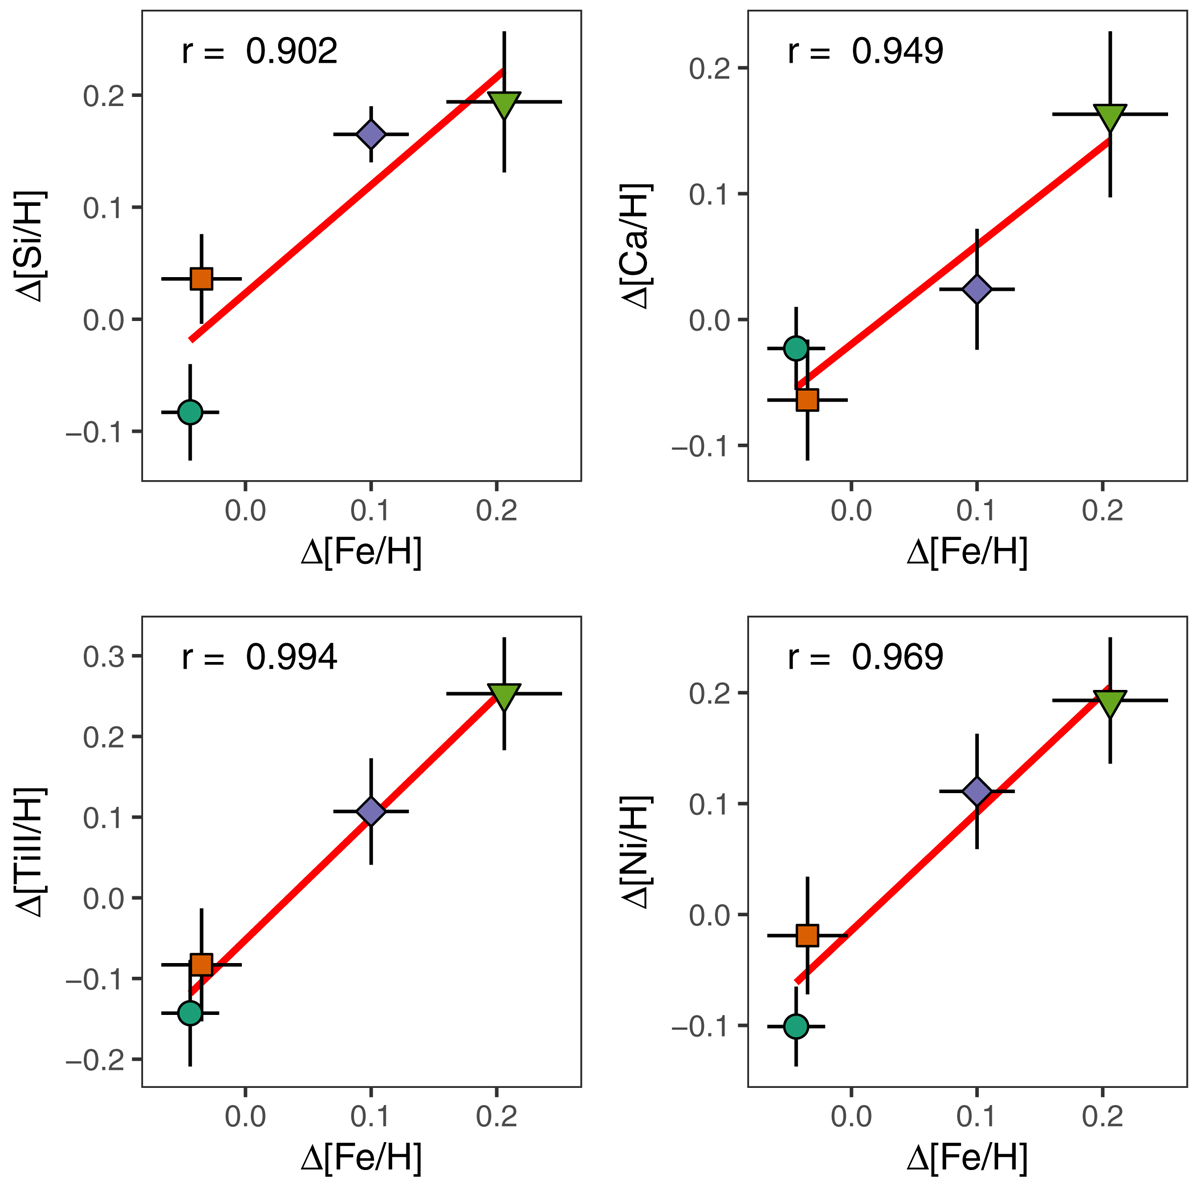
Fig. 8.
Download original image
Differential abundances (with respect S55974) for Si, Ca, Ti II, and Ni, respectively, plotted against Δ[Fe/H] for the analysed stars. Symbols are the same as in Fig. 7. The solid red line is a linear fit to the data. The Pearson correlation coefficient is reported in the left top corner.
Current usage metrics show cumulative count of Article Views (full-text article views including HTML views, PDF and ePub downloads, according to the available data) and Abstracts Views on Vision4Press platform.
Data correspond to usage on the plateform after 2015. The current usage metrics is available 48-96 hours after online publication and is updated daily on week days.
Initial download of the metrics may take a while.