Open Access
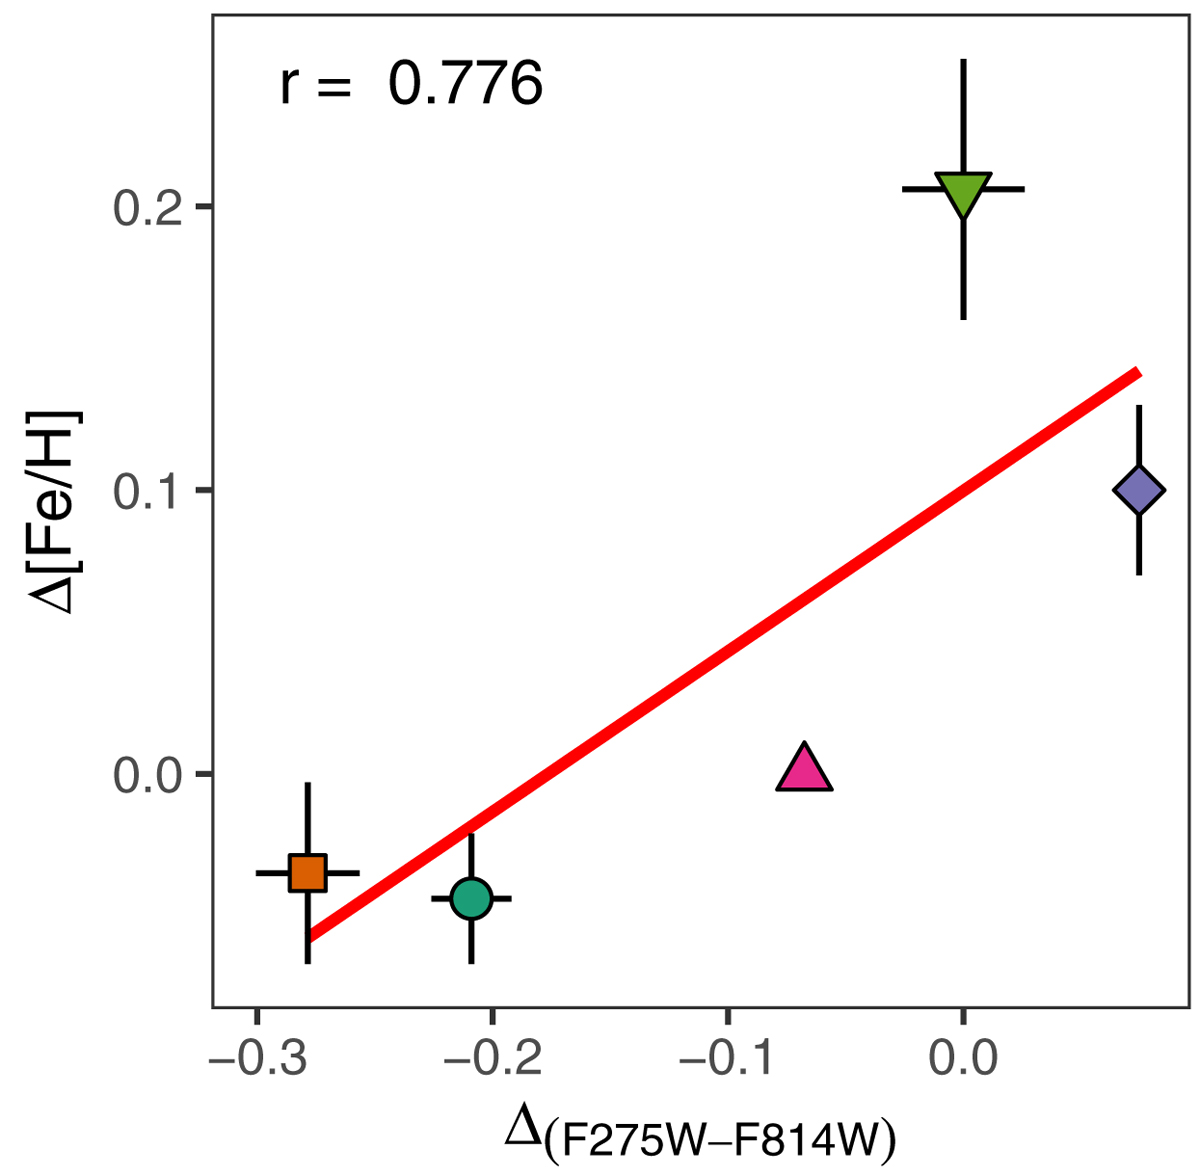
Fig. 7.
Download original image
Abundance differences Δ[Fe/H] with respect to the reference star S55974 (also shown in the plot) as a function of the corresponding ΔF275W, F814W coordinate in the chromosome map of NGC 2808. The solid red line is a linear fit to the data. The Pearson correlation coefficient is reported in the top left corner.
Current usage metrics show cumulative count of Article Views (full-text article views including HTML views, PDF and ePub downloads, according to the available data) and Abstracts Views on Vision4Press platform.
Data correspond to usage on the plateform after 2015. The current usage metrics is available 48-96 hours after online publication and is updated daily on week days.
Initial download of the metrics may take a while.