Fig. 6.
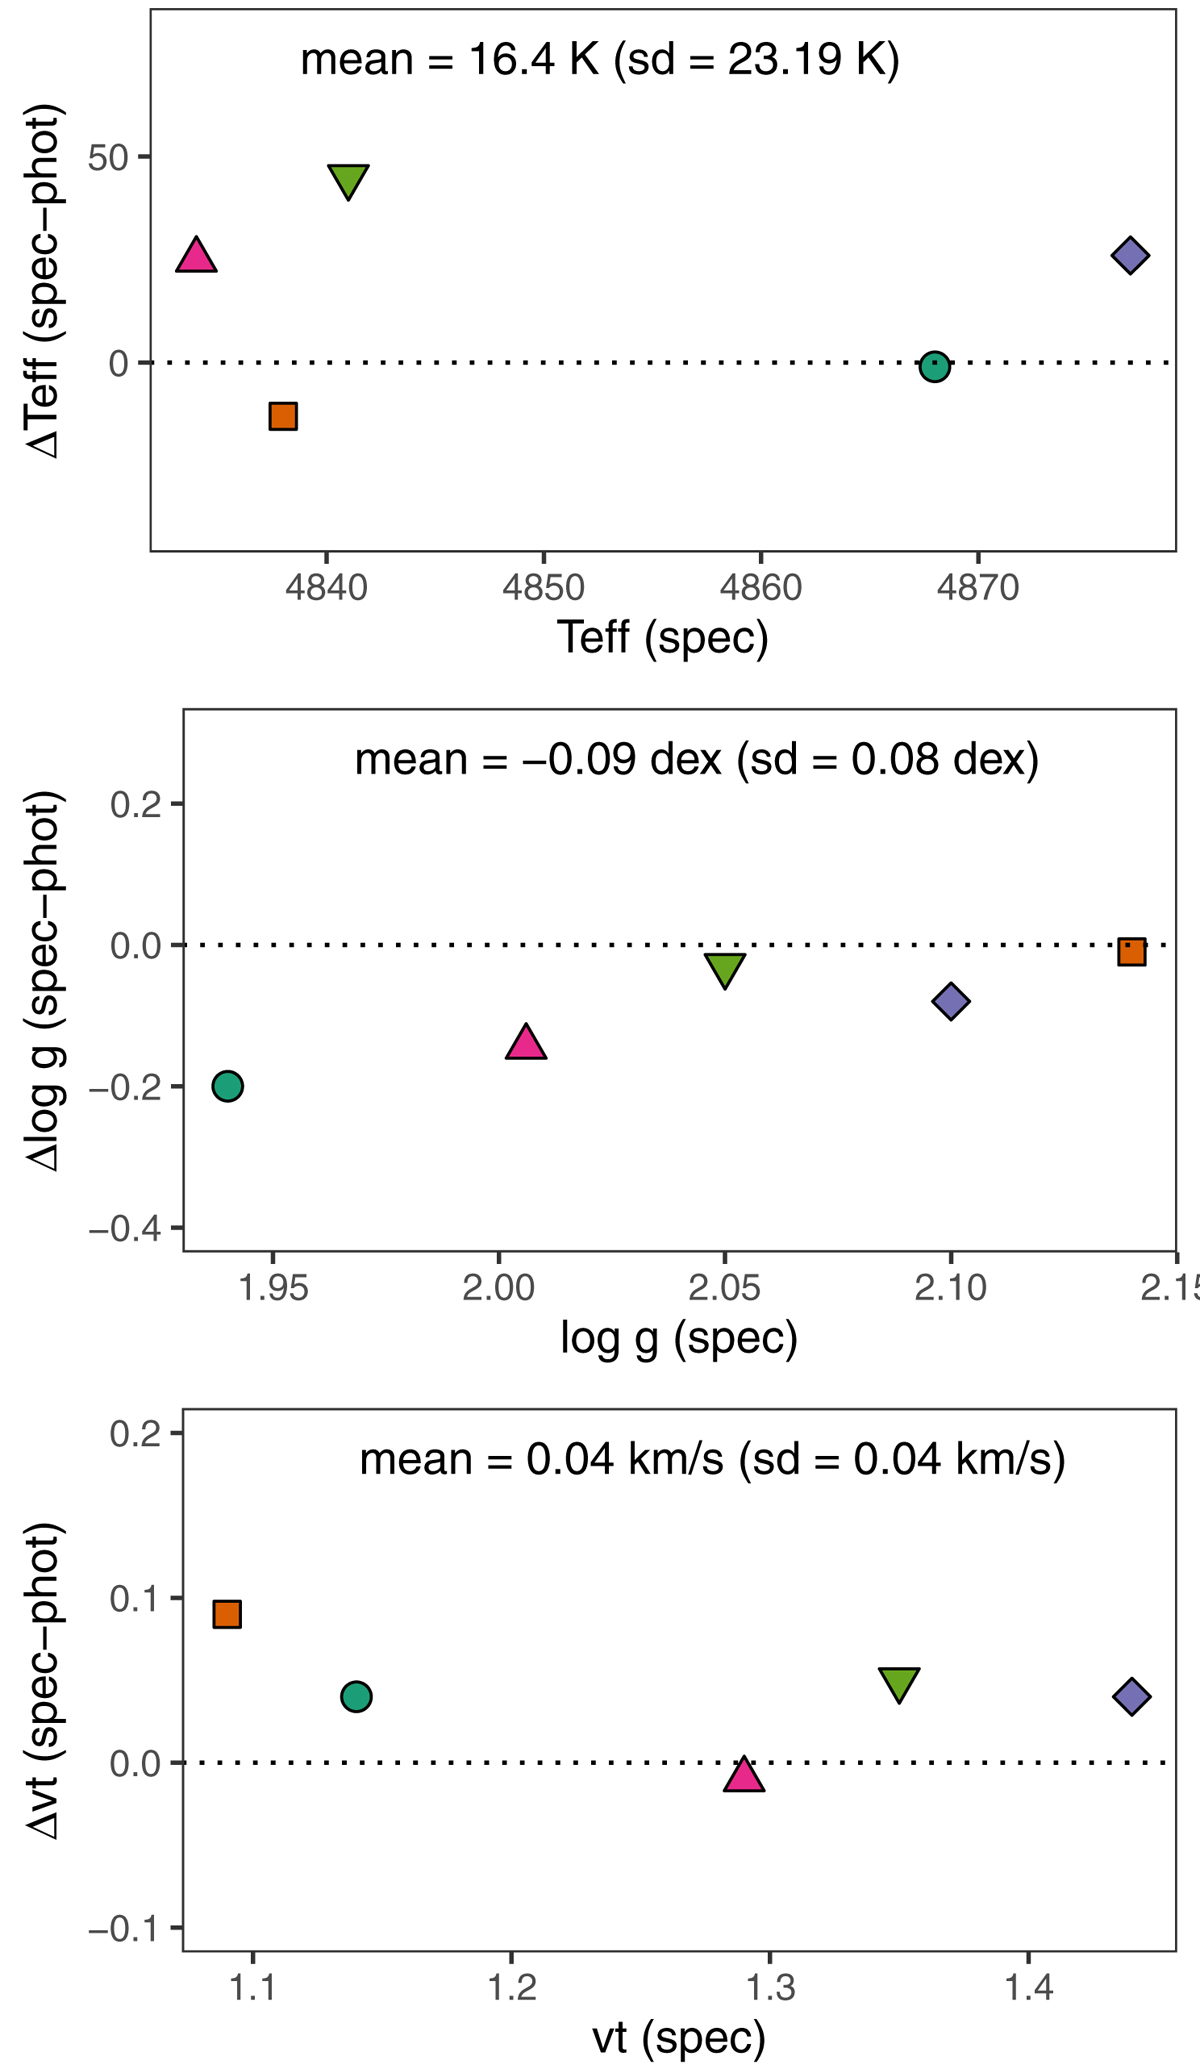
Download original image
Difference between the values determined by Cabrera-Ziri et al. (2019) from photometry, and their counterparts from spectroscopy, for effective temperature (ΔTeff), surface gravity (Δlog g), and microturbolent velocity (Δvt), respectively. Symbols are the same as in Fig. 1. The average differences with respect to Cabrera-Ziri et al. (2019), along with their associated standard deviation, are listed in each panel.
Current usage metrics show cumulative count of Article Views (full-text article views including HTML views, PDF and ePub downloads, according to the available data) and Abstracts Views on Vision4Press platform.
Data correspond to usage on the plateform after 2015. The current usage metrics is available 48-96 hours after online publication and is updated daily on week days.
Initial download of the metrics may take a while.