Fig. 3.
Download original image
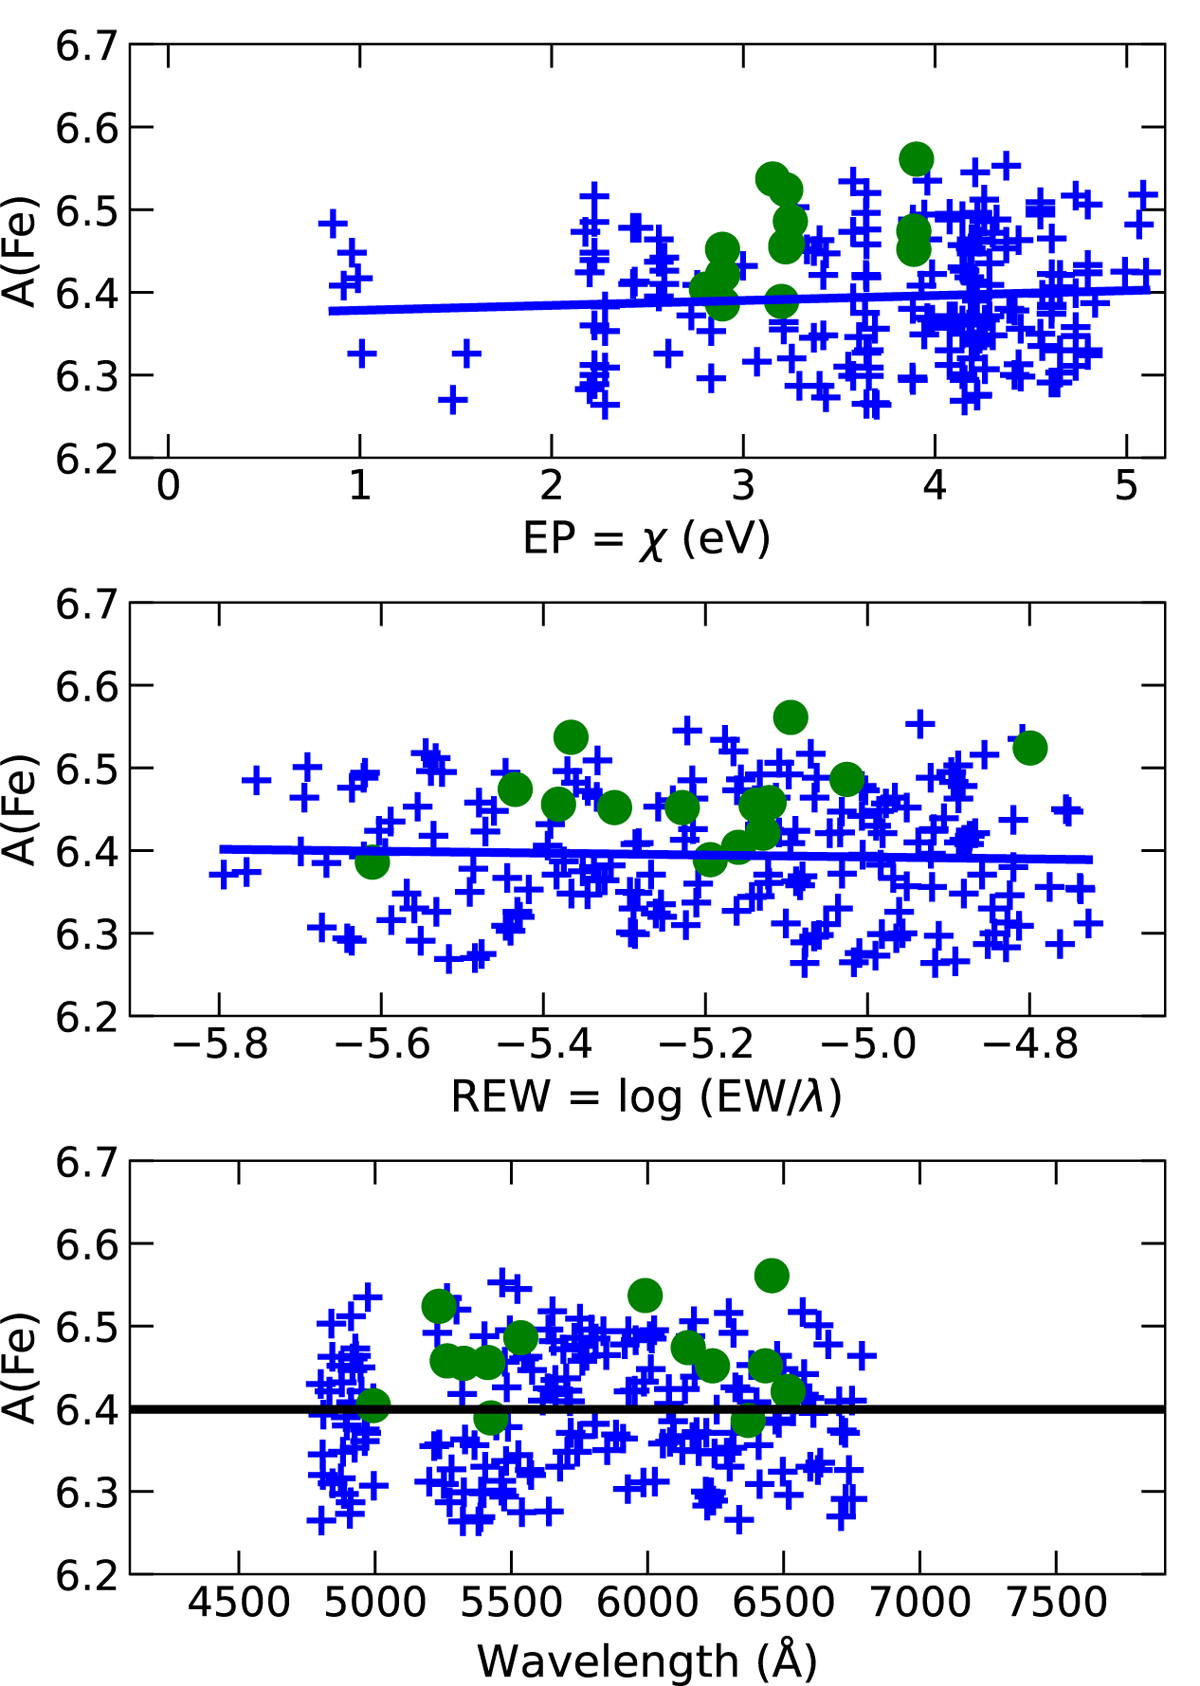
Absolute abundances from individual neutral iron lines A(Fe I) for the reference object S55974 vs their EP, REW, and wavelength (from top to bottom) using the atmospheric parameters from Cabrera-Ziri et al. (2019). Blue crosses denote abundances from the Fe I lines and green circles indicate abundances from the Fe II lines. The solid blue lines are linear fits to the Fe I data and the black line in the bottom panel is a horizontal line at the average value of the iron abundance.
Current usage metrics show cumulative count of Article Views (full-text article views including HTML views, PDF and ePub downloads, according to the available data) and Abstracts Views on Vision4Press platform.
Data correspond to usage on the plateform after 2015. The current usage metrics is available 48-96 hours after online publication and is updated daily on week days.
Initial download of the metrics may take a while.