Fig. 8.
Download original image
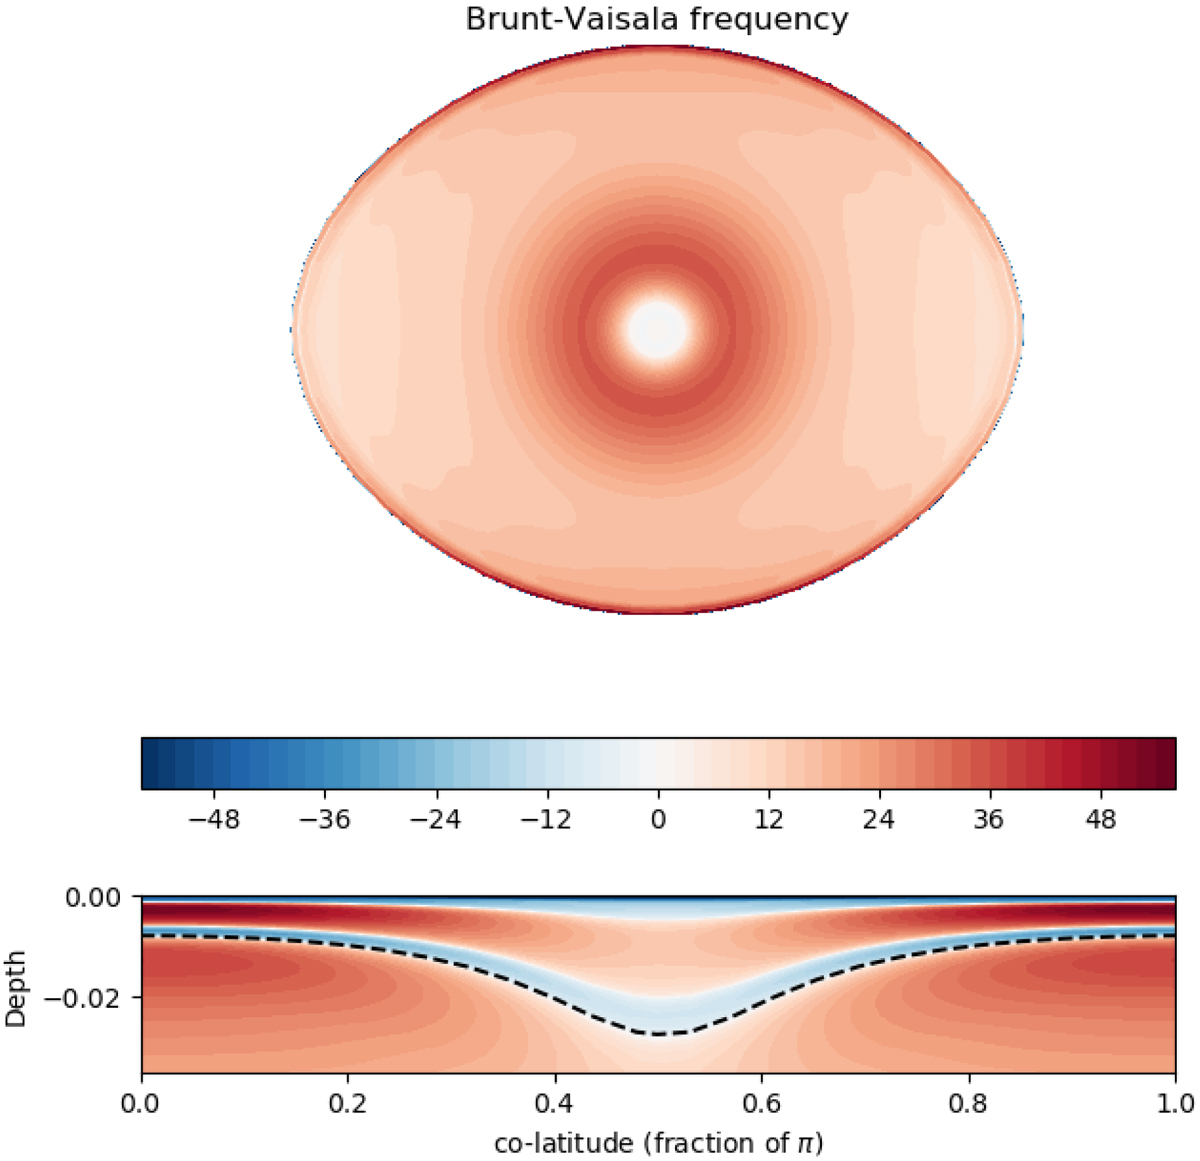
Meridional section of the concordance model of Altair (e.g. Bouchaud et al. 2020) showing the Brunt–Väisälä frequency. Units on the colour bar are cycle/day. Negative values show the convectively unstable regions. The lower plot gives a zoomed-in view of the surface layers and the dashed line shows the T = 50 000 K isotherm around which the second ionisation of helium takes place. Depth is scaled by the polar radius of the model.
Current usage metrics show cumulative count of Article Views (full-text article views including HTML views, PDF and ePub downloads, according to the available data) and Abstracts Views on Vision4Press platform.
Data correspond to usage on the plateform after 2015. The current usage metrics is available 48-96 hours after online publication and is updated daily on week days.
Initial download of the metrics may take a while.