Fig. 7.
Download original image
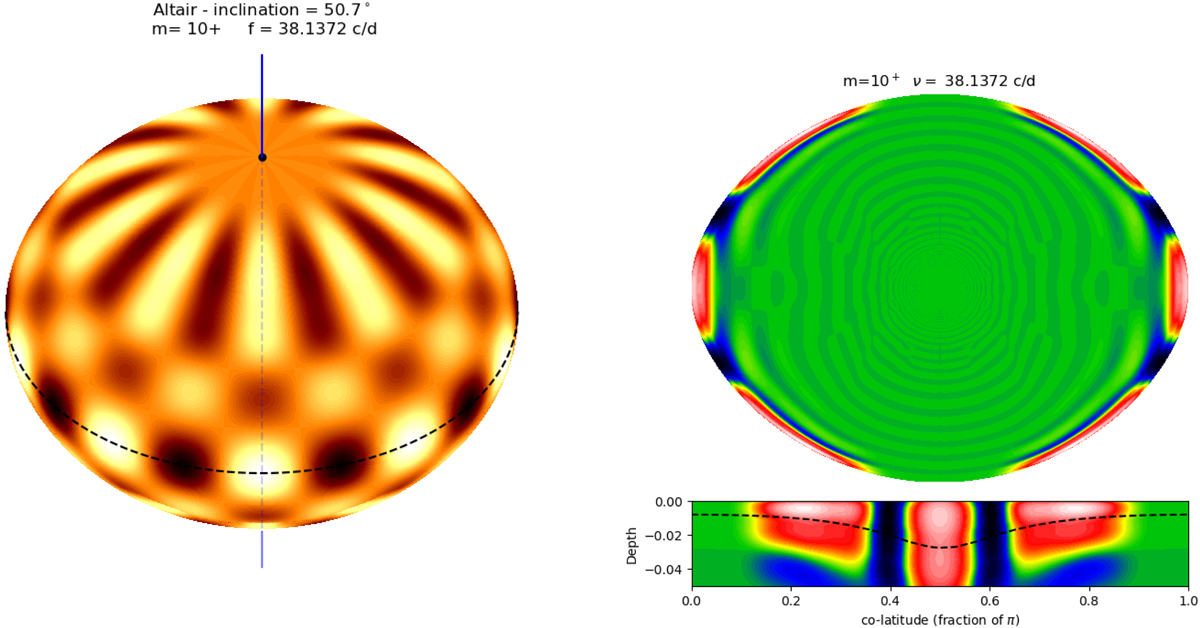
Surface amplitude (left) and meridional cut of the kinetic energy density (right) of a gravito-inertial mode that may give a signal at f = 38.14 c/d. The bottom-right plot is a zoomed-in view of the surface layers, and the dashed line shows the T = 50 000 K isotherm, around which the second ionisation of helium takes place. The depth is scaled by the polar radius of the model.
Current usage metrics show cumulative count of Article Views (full-text article views including HTML views, PDF and ePub downloads, according to the available data) and Abstracts Views on Vision4Press platform.
Data correspond to usage on the plateform after 2015. The current usage metrics is available 48-96 hours after online publication and is updated daily on week days.
Initial download of the metrics may take a while.