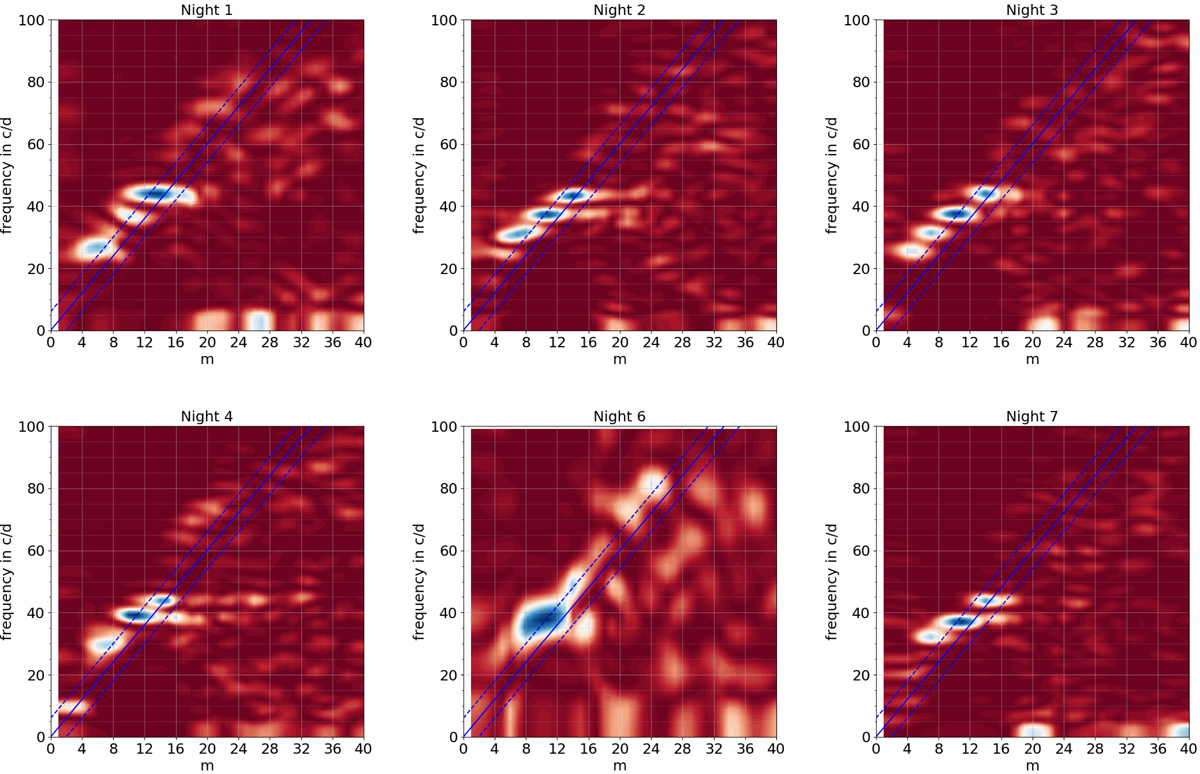
Fig. 4.
Download original image
m − ω diagram for the six nights, showing the spectral power as a function of m and frequency in the observer’s frame. The solid blue line shows the time frequency of a standing wave in the co-rotating frame characterised by wavenumber m. Modes above that line are prograde, and modes below are retrograde. The two dashed blue lines delineate the inertial frequency band.
Current usage metrics show cumulative count of Article Views (full-text article views including HTML views, PDF and ePub downloads, according to the available data) and Abstracts Views on Vision4Press platform.
Data correspond to usage on the plateform after 2015. The current usage metrics is available 48-96 hours after online publication and is updated daily on week days.
Initial download of the metrics may take a while.