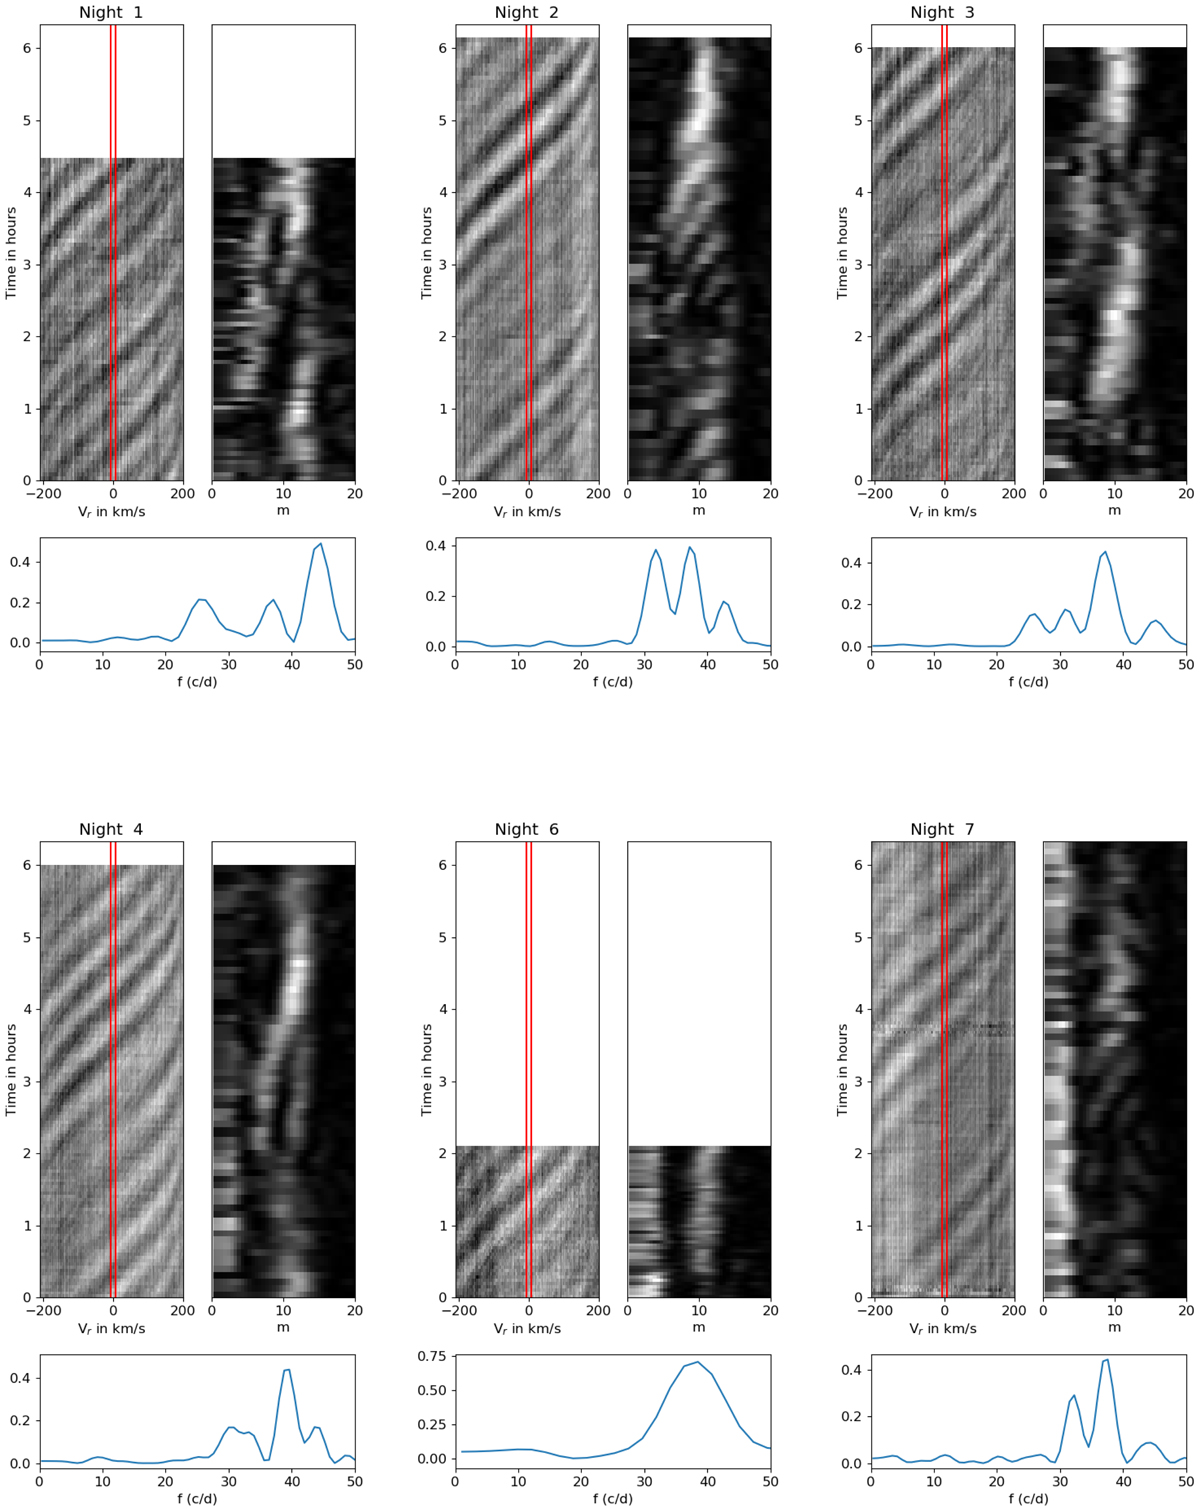
Fig. 3.
Download original image
Global view of the relative fluctuations in the mean line profile for each of the six nights of observation. For each night we show in the top left panel the signal as a function of time and radial velocity in km s−1. In the top-right panel we show the Lomb-Scargle periodogram of the line profile fluctuations in (virtual) longitude as a function of time and the azimuthal wavenumber m. The bottom plot shows a Lomb-Scargle periodogram of the time variations of the intensity in the eight pixels at the line centre that are marked by the red lines in the top-left panels.
Current usage metrics show cumulative count of Article Views (full-text article views including HTML views, PDF and ePub downloads, according to the available data) and Abstracts Views on Vision4Press platform.
Data correspond to usage on the plateform after 2015. The current usage metrics is available 48-96 hours after online publication and is updated daily on week days.
Initial download of the metrics may take a while.