Open Access
Fig. 7.
Download original image
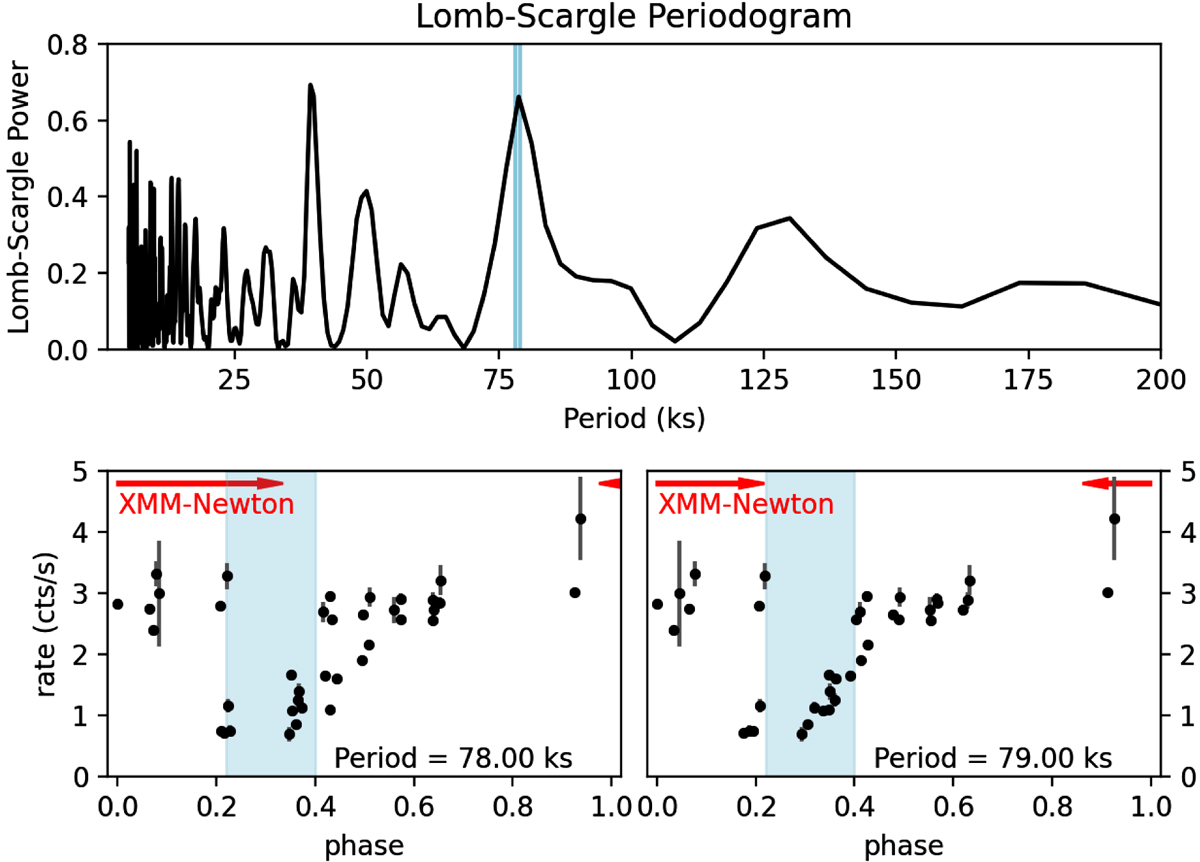
Top: Lomb-Scargle periodogram of NICER data, a peak is visible at a period of 79 ks. Bottom: NICER light curve (300 s bin) folded for a period of 78 ks (left) and 79 ks (right). With red arrows, we mark the duration of the XMM-Newton observation. The shaded region in phase outlines the low-flux states as shown in Fig. 5.
Current usage metrics show cumulative count of Article Views (full-text article views including HTML views, PDF and ePub downloads, according to the available data) and Abstracts Views on Vision4Press platform.
Data correspond to usage on the plateform after 2015. The current usage metrics is available 48-96 hours after online publication and is updated daily on week days.
Initial download of the metrics may take a while.