Fig. 7
Download original image
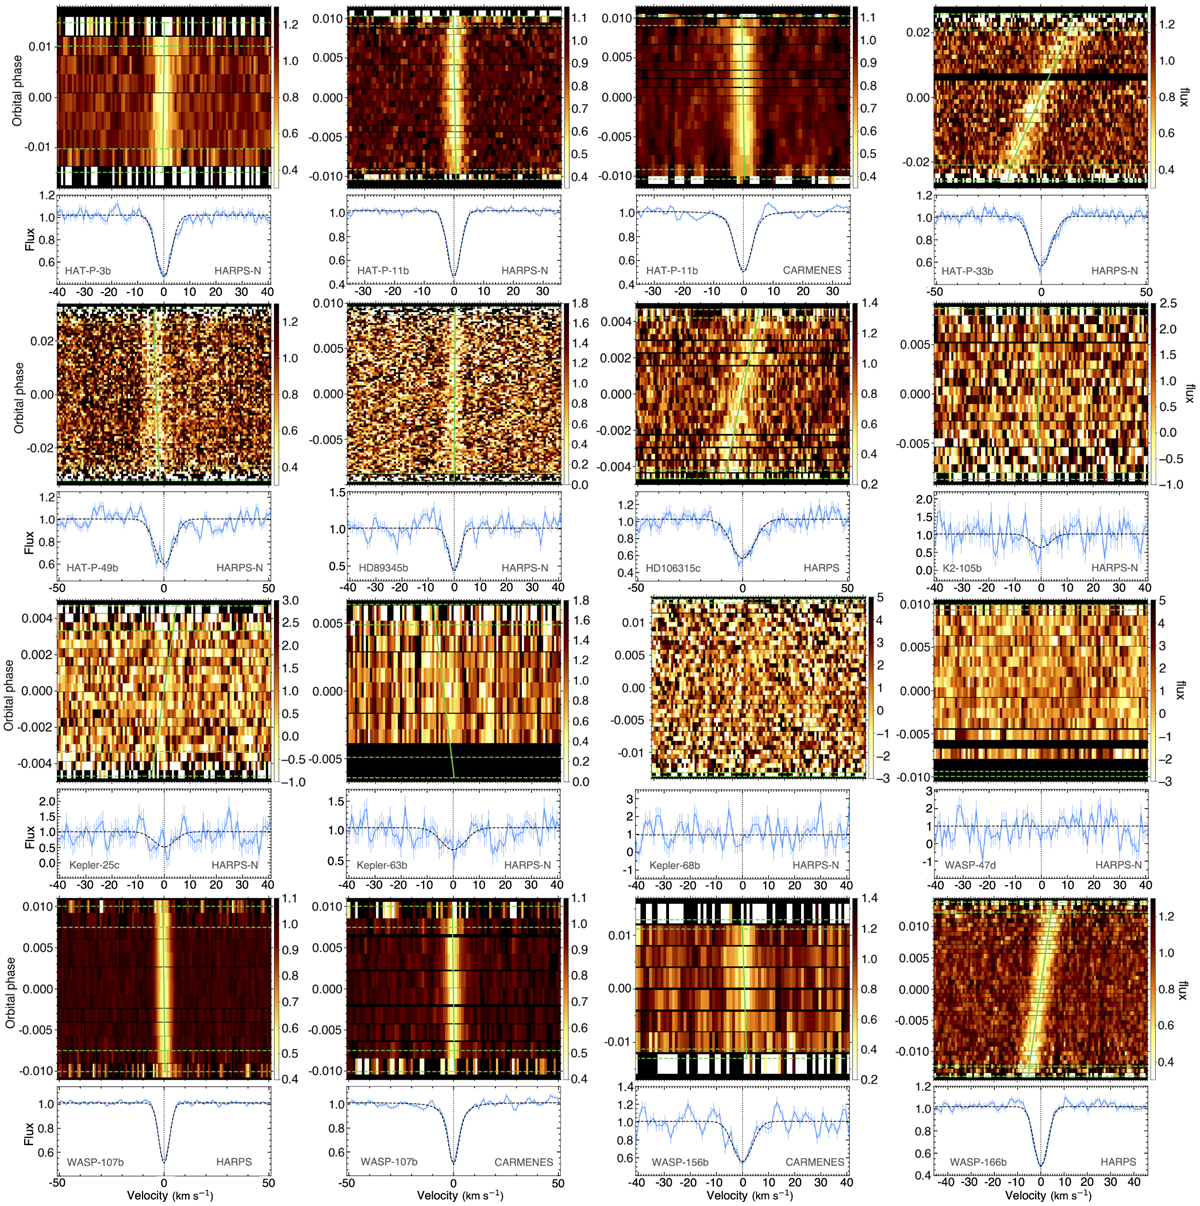
CCFintr for all transiting planets. When several datasets are available for a given instrument, they were binned together for clarity. Top subpanels: maps of the CCFintr, colored as a function of the flux (right axis), and plotted as a function of RV in the star rest frame (in abscissa) and orbital phase (in ordinate). Missing or out-of-transit data is plotted in black. When the S/N is high enough, the core of the stellar line from the planet-occulted regions can be seen as a bright streak. Transit contacts are shown as green dashed lines. The green solid line shows the stellar surface RV model from the RMR best fit, when detected. Bottom subpanels: master CCFintr, calculated as the weighted average of the fitted in-transit exposures after they were aligned in a common rest frame using the model surface RVs. The occulted lines of WASP-107 vary in contrast with μ (see text), and we show here their best-fit model at disk center.
Current usage metrics show cumulative count of Article Views (full-text article views including HTML views, PDF and ePub downloads, according to the available data) and Abstracts Views on Vision4Press platform.
Data correspond to usage on the plateform after 2015. The current usage metrics is available 48-96 hours after online publication and is updated daily on week days.
Initial download of the metrics may take a while.