Fig. 5
Download original image
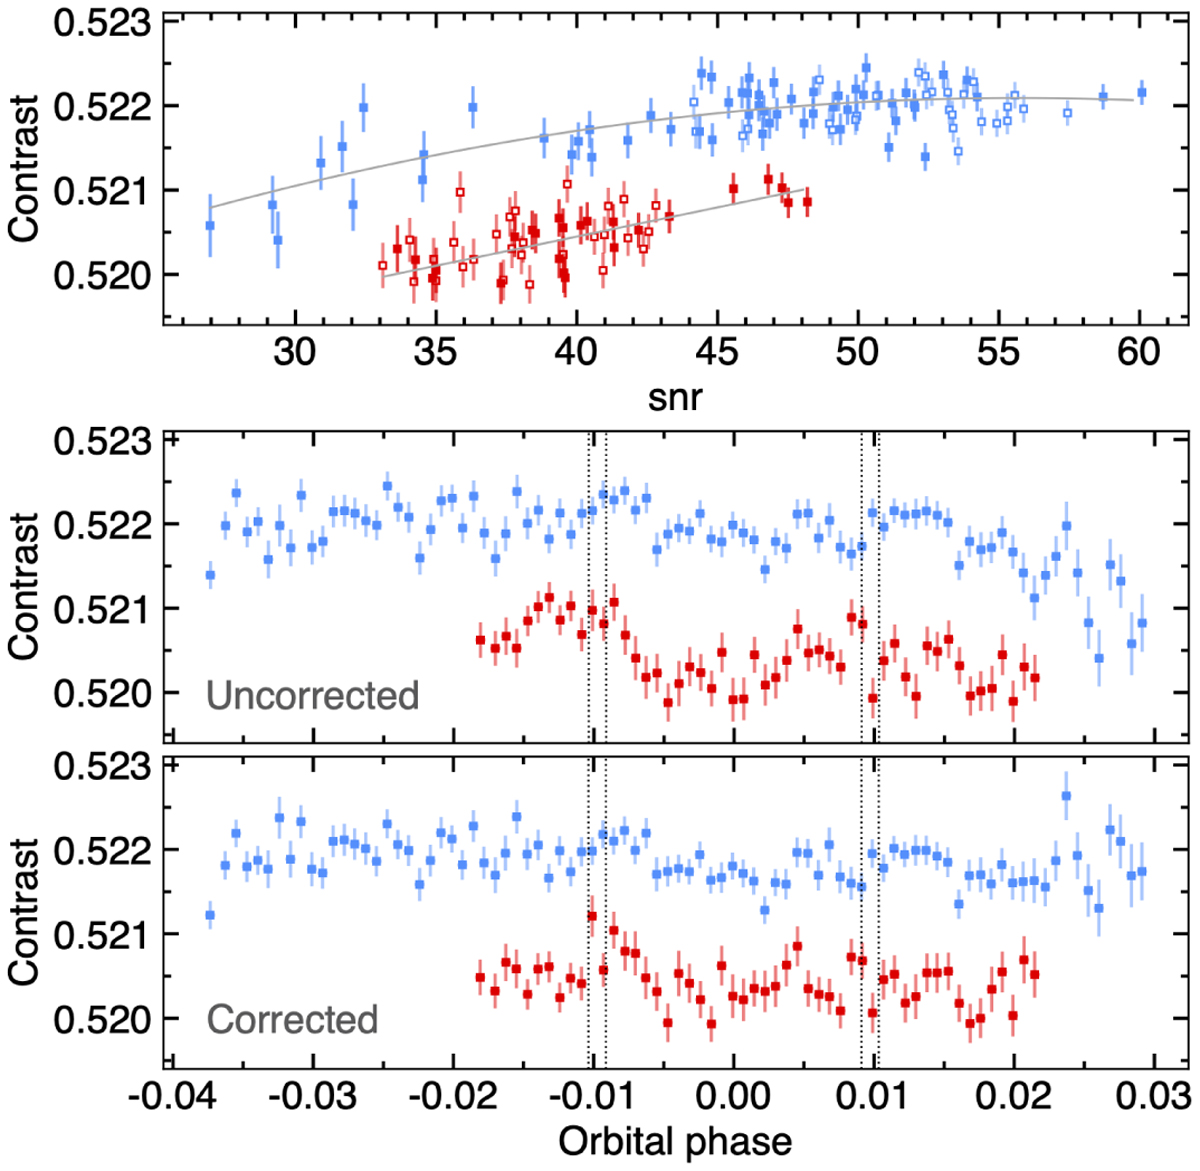
Contrast of the HAT-P-11 CCFDI in HARPS-N Visit 1 (blue) and 2 (red). Top panel: correlation between the contrast and S/N, fitted on the out-of-transit measurements (gray line). In-transit measurements are plotted with empty symbols. Middle and bottom panels: contrast as function of orbital phase before and after correction using the best-fit model from the top panel.
Current usage metrics show cumulative count of Article Views (full-text article views including HTML views, PDF and ePub downloads, according to the available data) and Abstracts Views on Vision4Press platform.
Data correspond to usage on the plateform after 2015. The current usage metrics is available 48-96 hours after online publication and is updated daily on week days.
Initial download of the metrics may take a while.