Fig. 4
Download original image
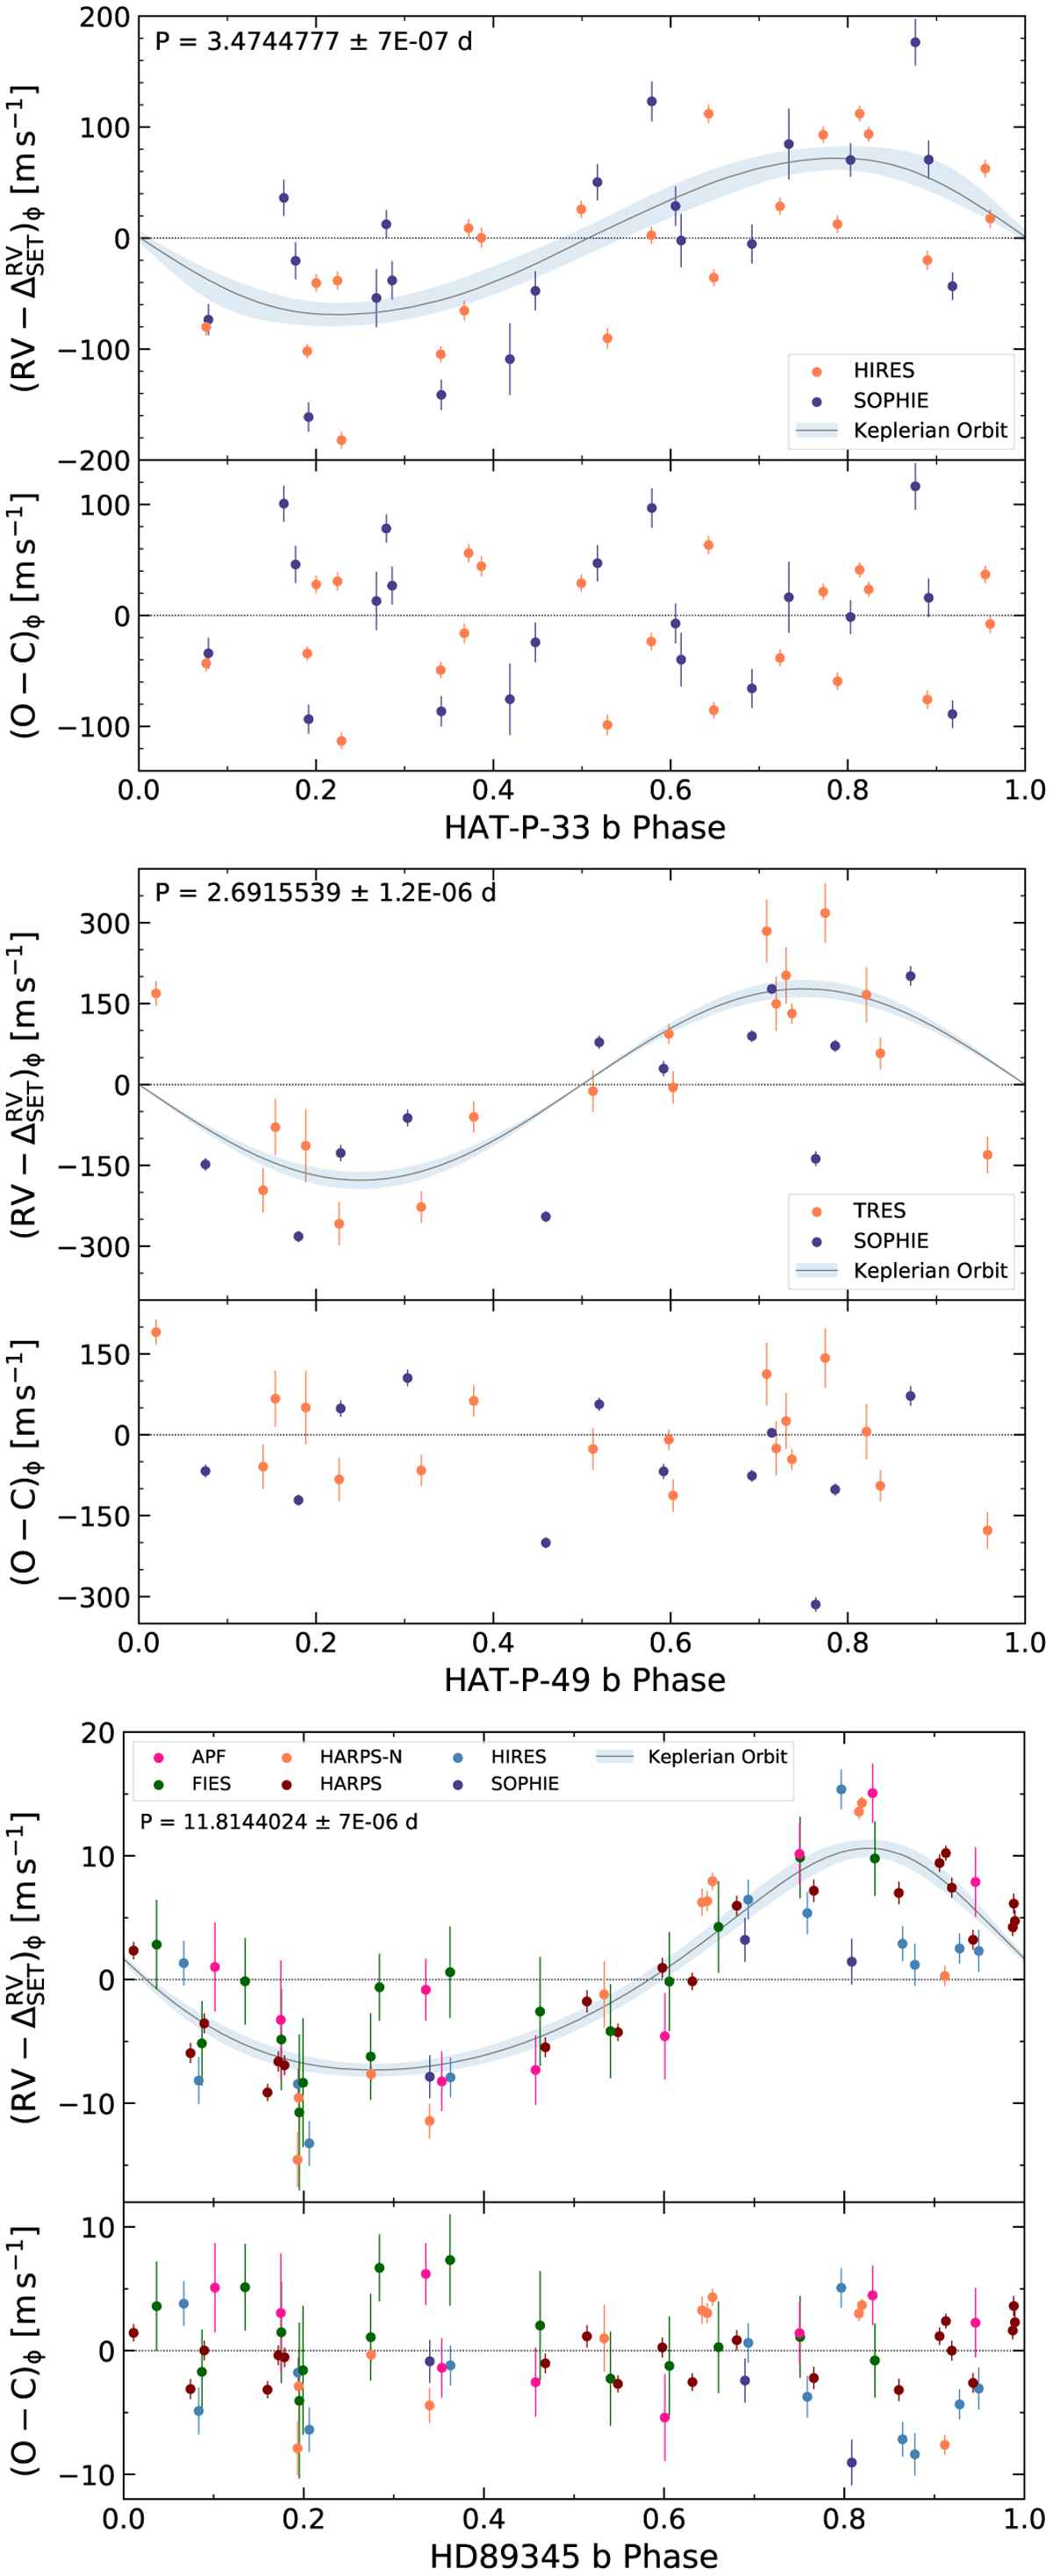
Phase-folded RV evolution of HAT-P-33, HAT-P-49, and HD 89345. On each figure, the top panel shows the RV variation relative to a fitted offset and linear trend, the solid line and its blue overlay correspond to the orbital solution presented in this study (Sect. 3.4) with its relative 1σ uncertainty, respectively, and used to compute the residuals in the bottom panel. The dispersion of the measurements around the Keplerian solutions is larger than the individual estimated error bars due to the stellar jitter, which is not included in the plotted uncertainties.
Current usage metrics show cumulative count of Article Views (full-text article views including HTML views, PDF and ePub downloads, according to the available data) and Abstracts Views on Vision4Press platform.
Data correspond to usage on the plateform after 2015. The current usage metrics is available 48-96 hours after online publication and is updated daily on week days.
Initial download of the metrics may take a while.