Fig. 2
Download original image
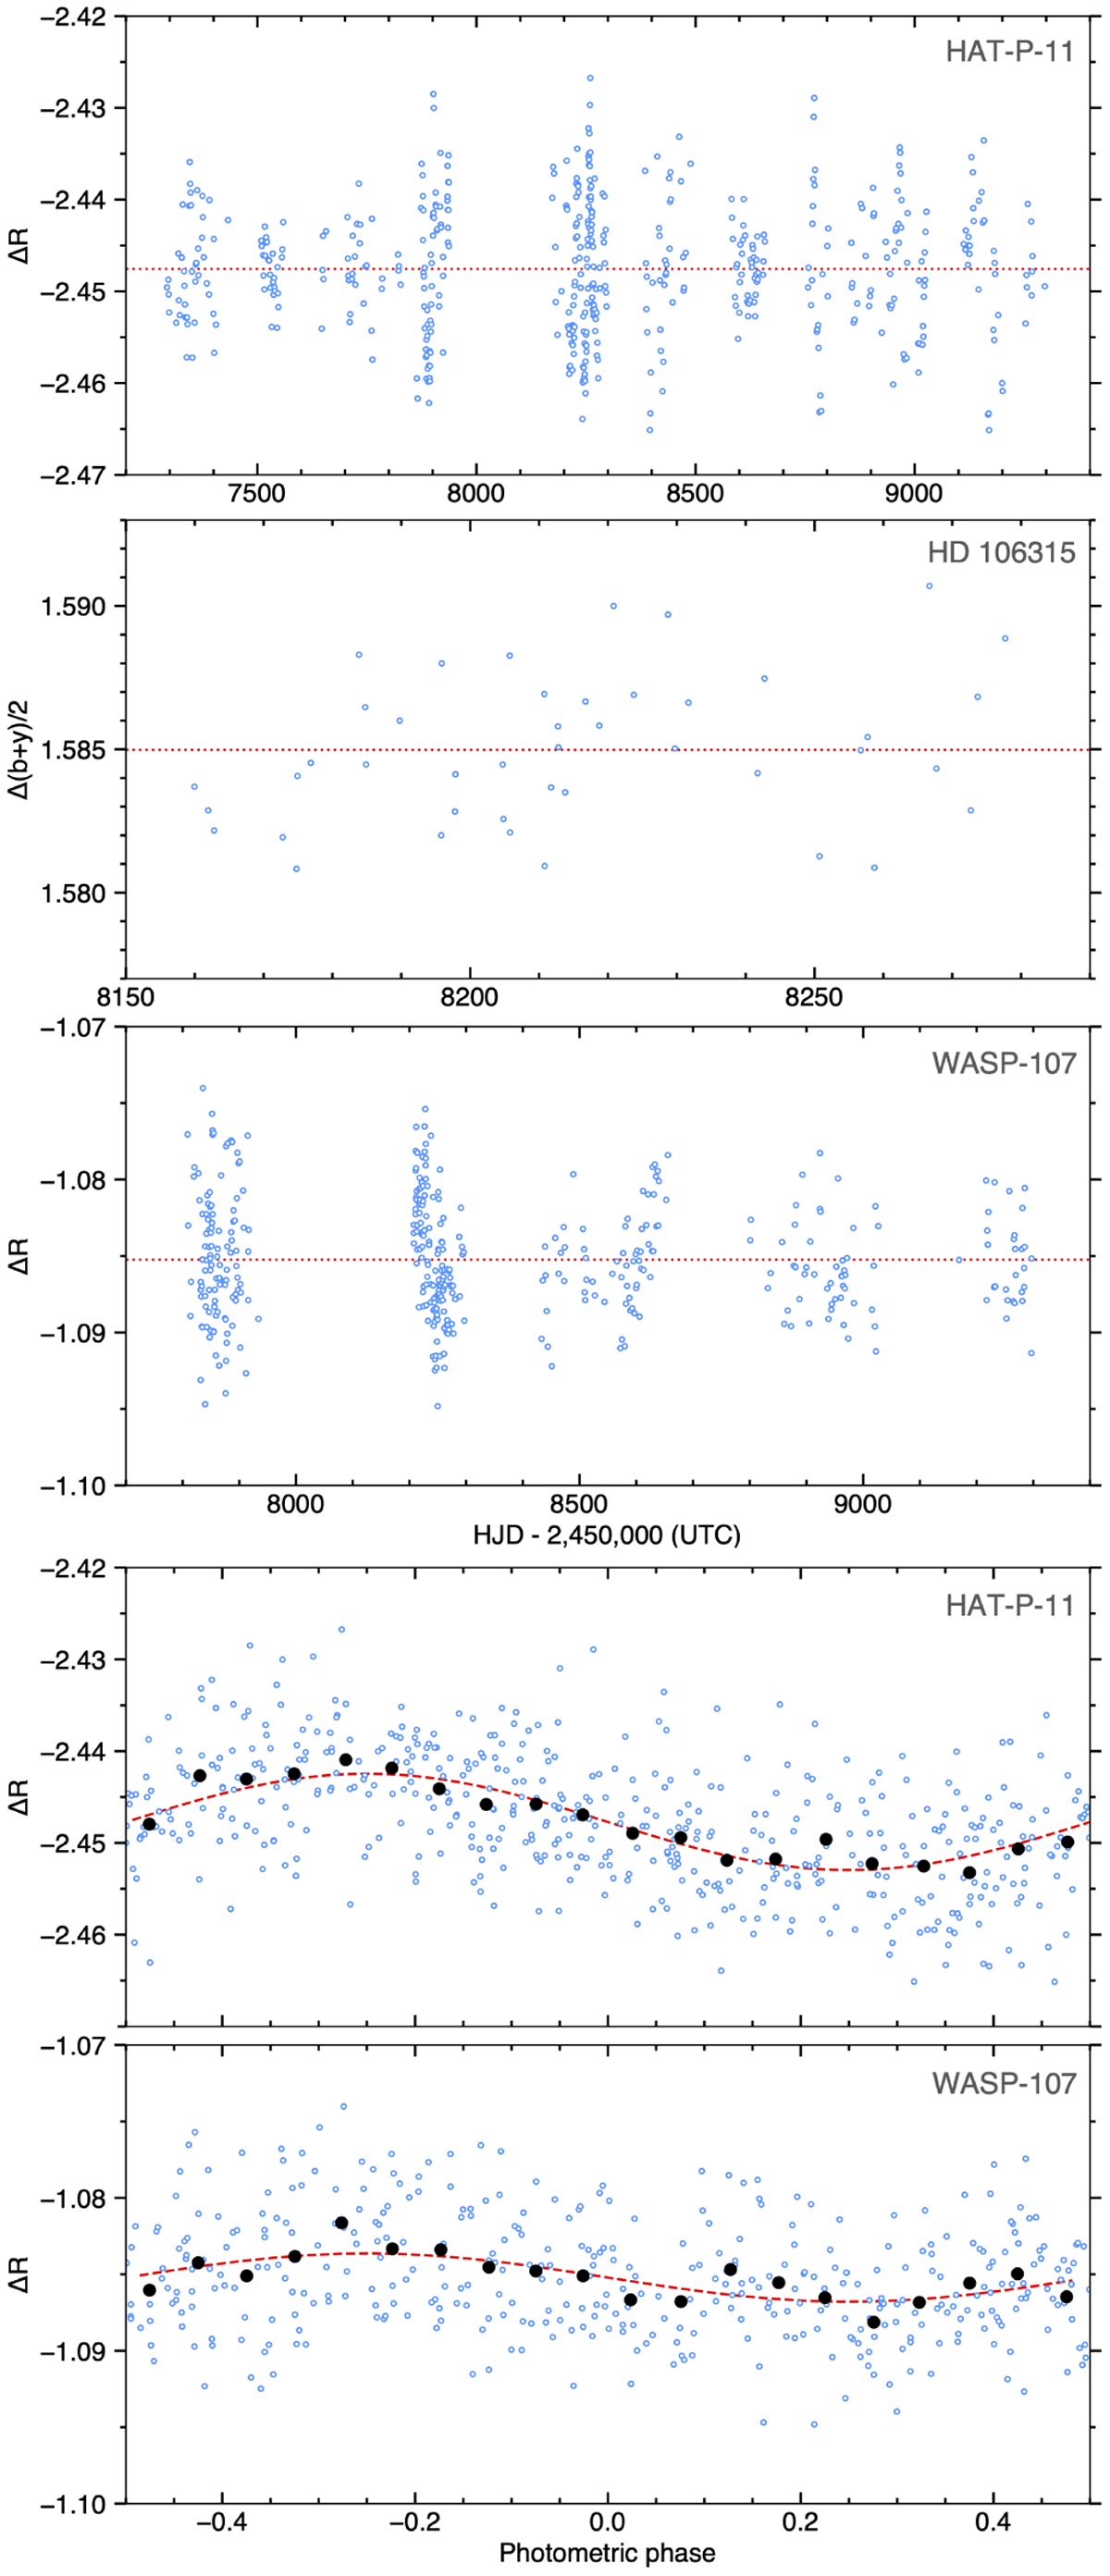
Top panels: differential magnitudes of HAT-P-11, HD106315, and WASP-107 as a function of Heliocentric Julian Date minus 2 450 000. Red lines show the mean values over the sequence. Bottom panels: HAT-P-11 and WASP-107 data phase-folded with the measured rotational modulation periods of 29.5 and 8.7 days. Red curves show sinusoidal fits to the data, binned into black points.
Current usage metrics show cumulative count of Article Views (full-text article views including HTML views, PDF and ePub downloads, according to the available data) and Abstracts Views on Vision4Press platform.
Data correspond to usage on the plateform after 2015. The current usage metrics is available 48-96 hours after online publication and is updated daily on week days.
Initial download of the metrics may take a while.