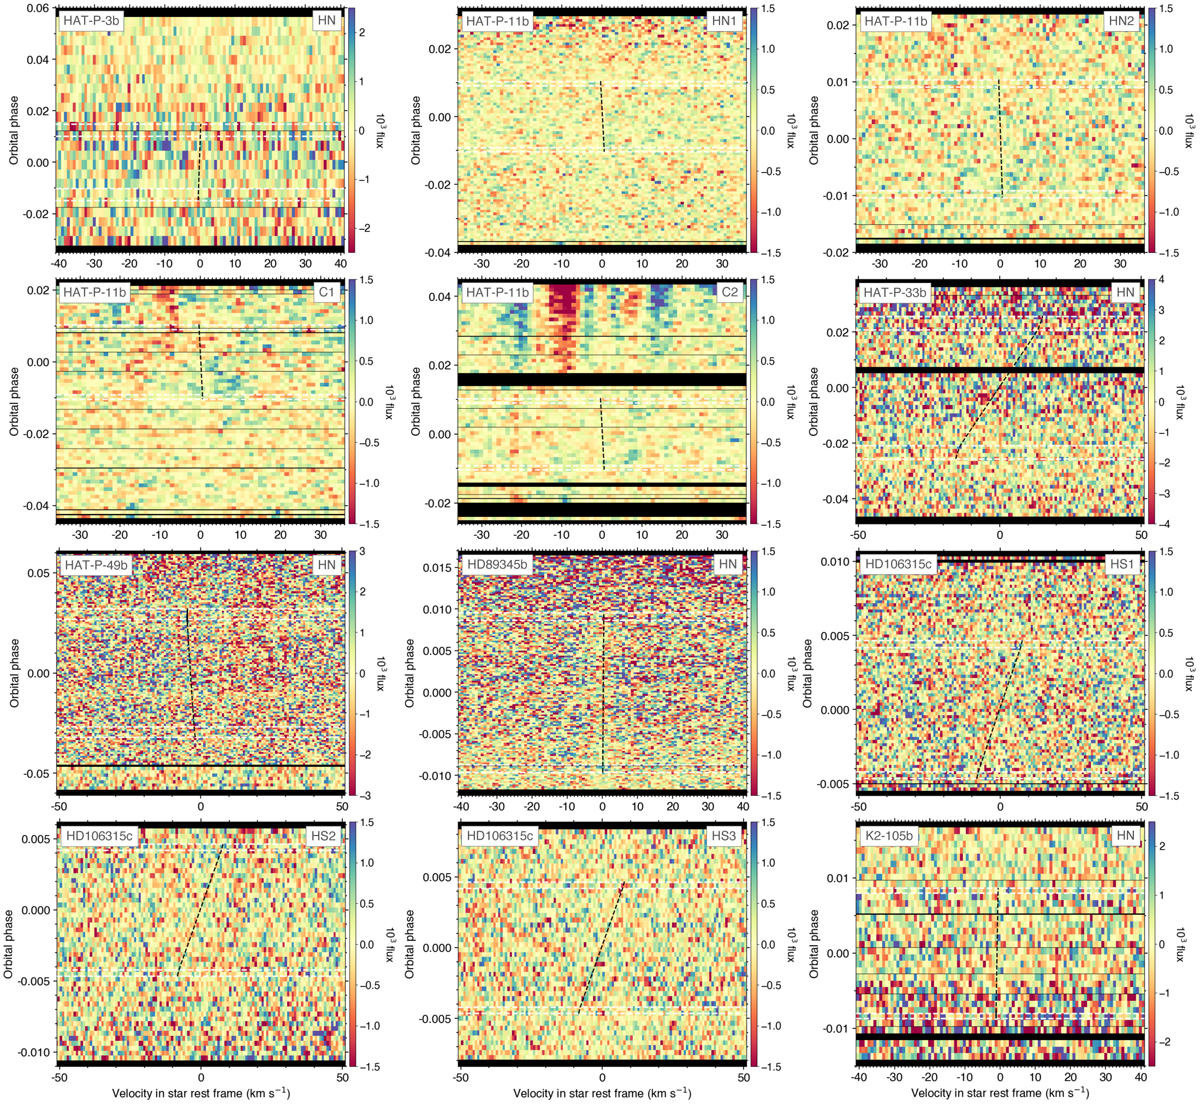
Fig. D.1
Download original image
Residual maps between the master-out and individual CCFDI (outside of transit) and between the CCFIntr and their best-fit RMR model (during transit). Transit contacts are shown as white dashed lines. Values are colored as a function of the residual flux and plotted as a function of RV in the star rest frame (in abscissa) and orbital phase (in ordinate). The black dashed line shows the stellar surface RV model from the RMR best fit.
Current usage metrics show cumulative count of Article Views (full-text article views including HTML views, PDF and ePub downloads, according to the available data) and Abstracts Views on Vision4Press platform.
Data correspond to usage on the plateform after 2015. The current usage metrics is available 48-96 hours after online publication and is updated daily on week days.
Initial download of the metrics may take a while.