Fig. 12
Download original image
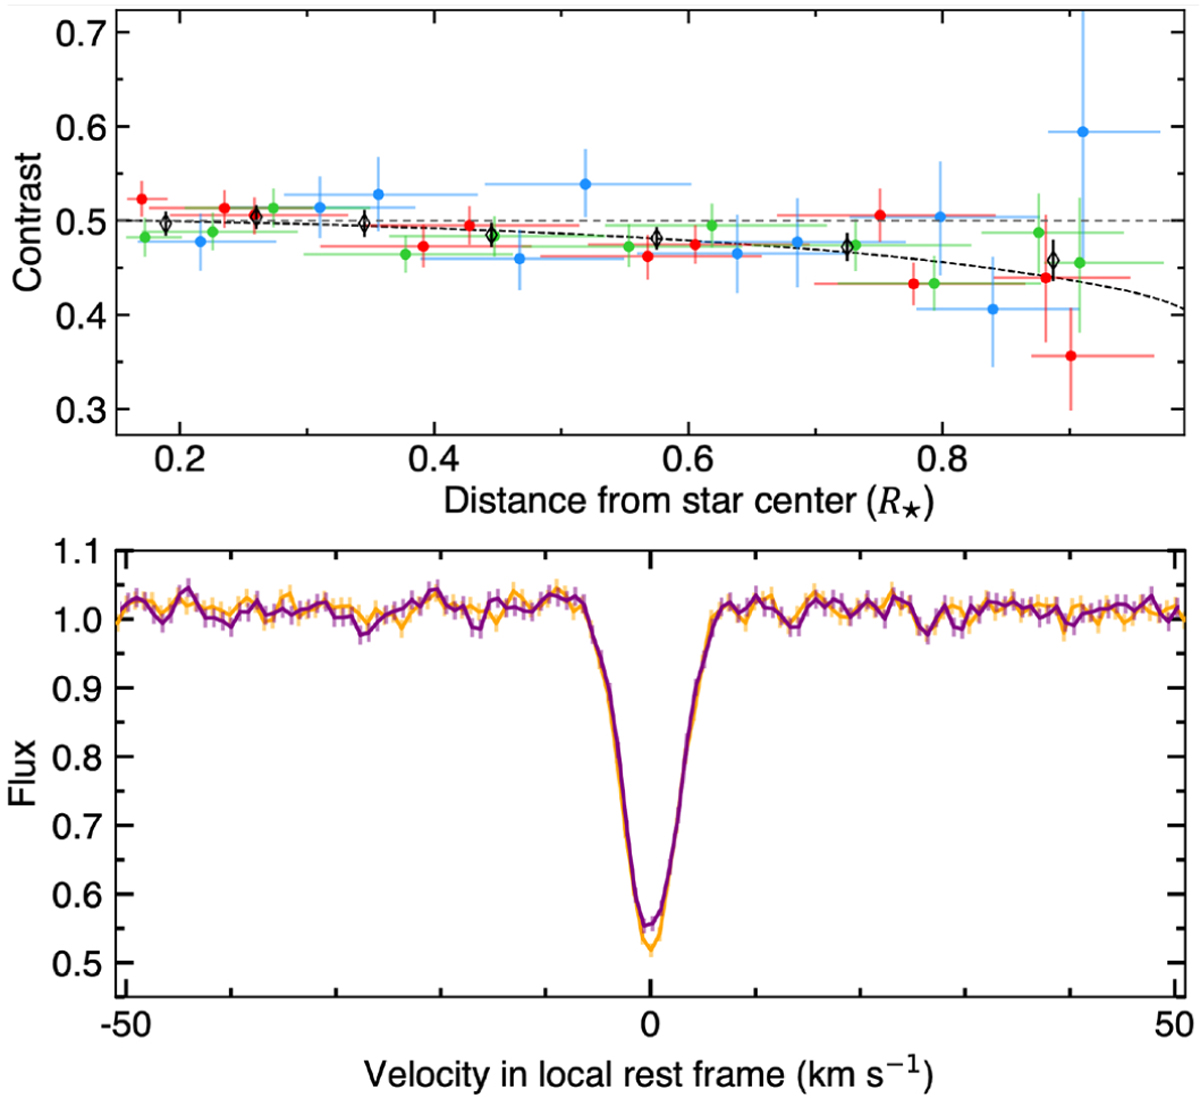
Variations in WASP-107 line contrast measured with HARPS. Upper panel: contrast as a function of the projected distance to the star center ![]() (for a given exposure time the range covered by the planet in r is closer to being constant than in μ). Measurements, derived from the fit to individual exposures (Sect. 4.3.2) in each visit (1 = blue, 2 = red, 3 = green), are binned into the black points. The dotted black line is the best-fit model from the joint RMR fit, to be compared with a constant contrast of 50% (horizontal gray line). Lower panel: average CCFintr at r = 0.34 (orange, from profiles over r = 0–0.5) and at r = 0.72 (purple, from profiles over r = 0.5–1). The stellar line keeps its Gaussian profile but is markedly deeper toward the limbs.
(for a given exposure time the range covered by the planet in r is closer to being constant than in μ). Measurements, derived from the fit to individual exposures (Sect. 4.3.2) in each visit (1 = blue, 2 = red, 3 = green), are binned into the black points. The dotted black line is the best-fit model from the joint RMR fit, to be compared with a constant contrast of 50% (horizontal gray line). Lower panel: average CCFintr at r = 0.34 (orange, from profiles over r = 0–0.5) and at r = 0.72 (purple, from profiles over r = 0.5–1). The stellar line keeps its Gaussian profile but is markedly deeper toward the limbs.
Current usage metrics show cumulative count of Article Views (full-text article views including HTML views, PDF and ePub downloads, according to the available data) and Abstracts Views on Vision4Press platform.
Data correspond to usage on the plateform after 2015. The current usage metrics is available 48-96 hours after online publication and is updated daily on week days.
Initial download of the metrics may take a while.