Open Access
Fig. 11
Download original image
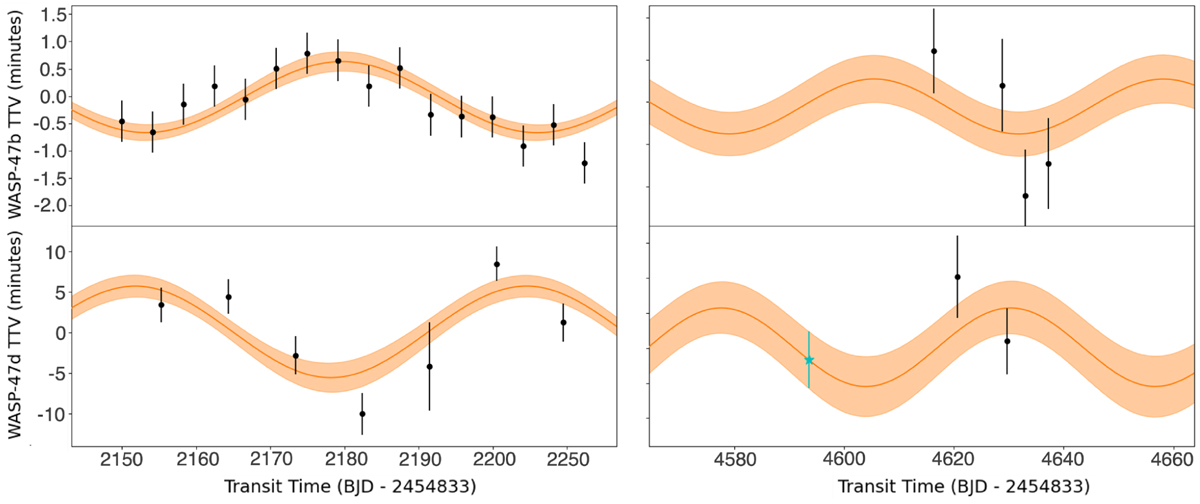
Measured TTVs for WASP-47 b (K2, upper left panel; TESS, upper right panel) and WASP-47 d (K2, lower left panel; Euler, lower right panel). The orange line shows our best-fit TTV model with the associated 1σ envelope. The blue star shows the mid-transit time for WASP-47 d predicted at the time of our RM observation.
Current usage metrics show cumulative count of Article Views (full-text article views including HTML views, PDF and ePub downloads, according to the available data) and Abstracts Views on Vision4Press platform.
Data correspond to usage on the plateform after 2015. The current usage metrics is available 48-96 hours after online publication and is updated daily on week days.
Initial download of the metrics may take a while.