Fig. 10
Download original image
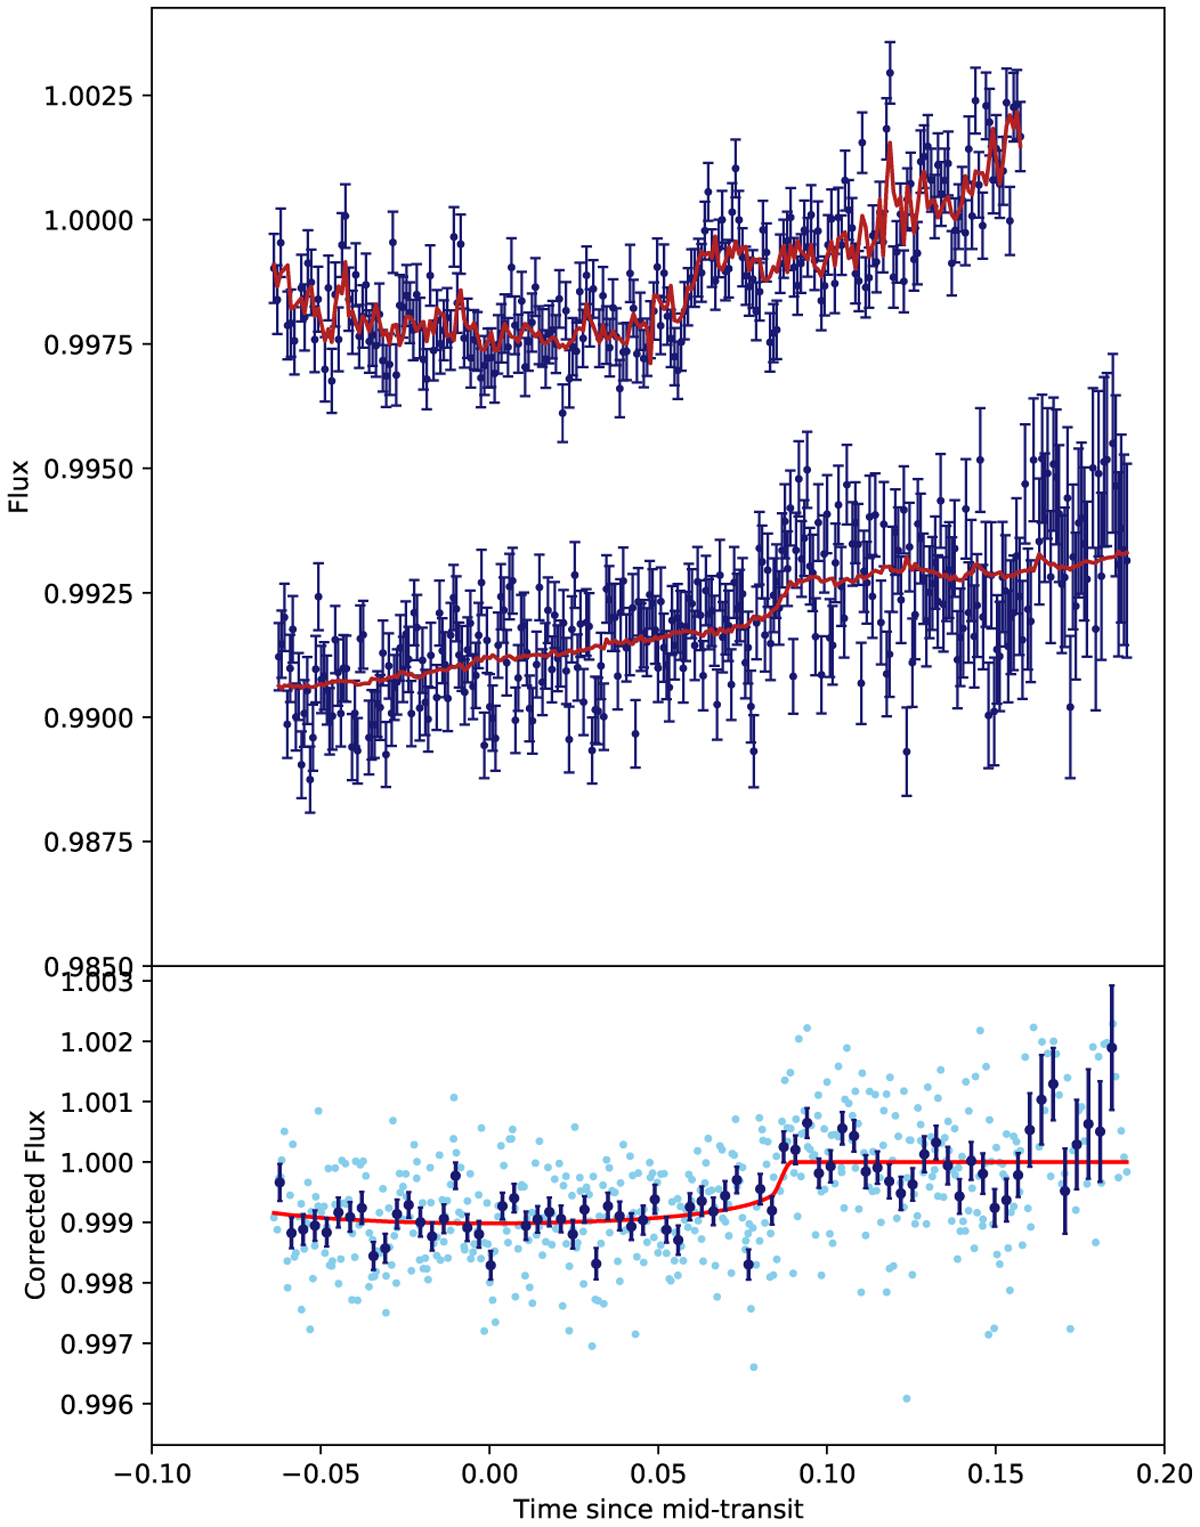
EulerCam light curves of Wasp-47 d. Top panel: raw data together with the transit and systematic model corresponding to the median posterior values. Bottom panel: systematics-corrected, phase-folded data together with the transit model. The unbinned data points are shown in light blue, while the dark blue points show the data binned into 2-min intervals.
Current usage metrics show cumulative count of Article Views (full-text article views including HTML views, PDF and ePub downloads, according to the available data) and Abstracts Views on Vision4Press platform.
Data correspond to usage on the plateform after 2015. The current usage metrics is available 48-96 hours after online publication and is updated daily on week days.
Initial download of the metrics may take a while.