Fig. 1
Download original image
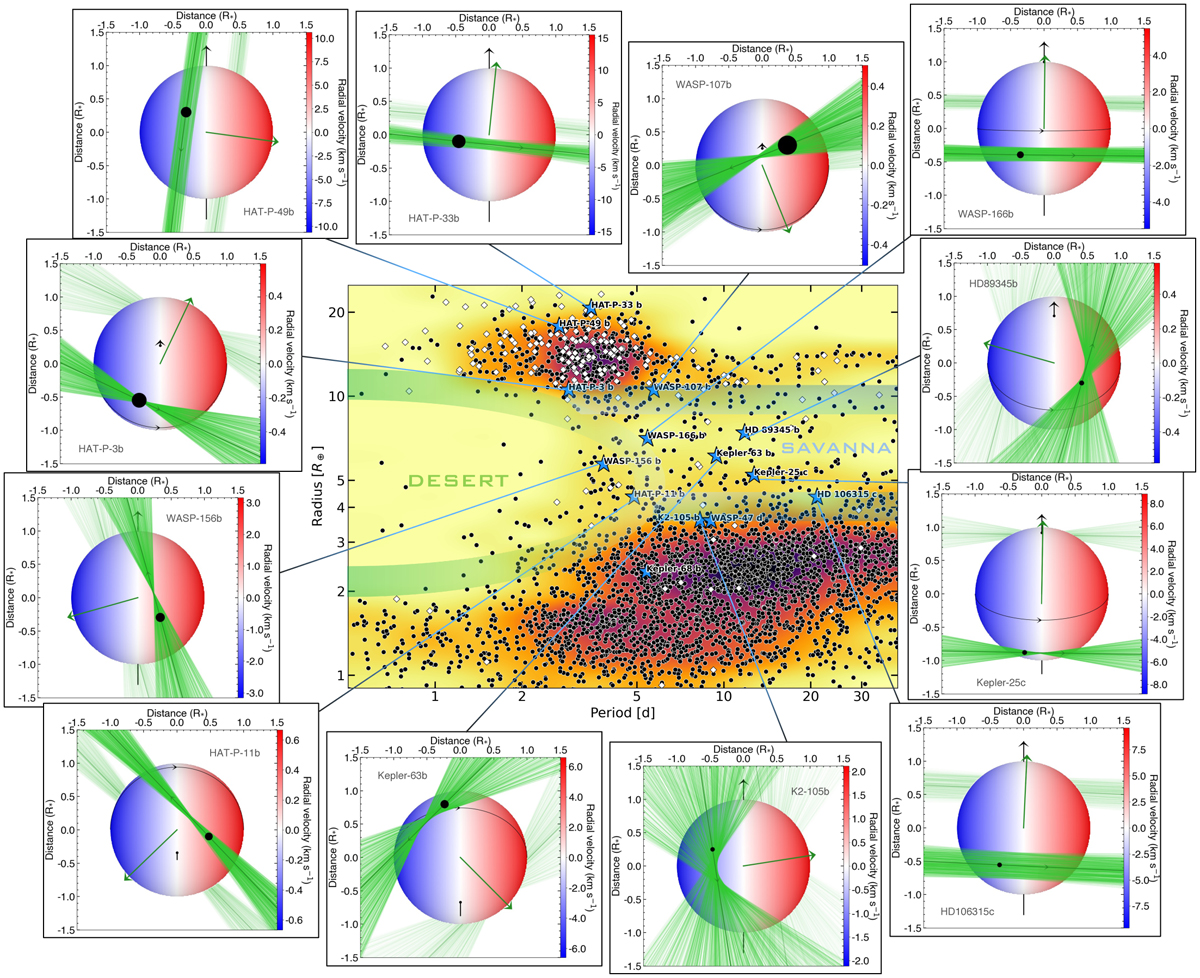
Distribution of close-in exoplanets as a function of their radius and orbital period. Green and blue contours show the approximate boundaries of the Neptunian desert and savanna. White squares indicate exoplanets with measured spin-orbit angles. Blue stars highlight planets in our sample, whose projections on the sky plane are displayed for the best-fit orbital architectures. By default, we show the configuration where the stellar spin-axis (shown as a black arrow extending from the north pole) is pointing toward the Earth, except for HAT-P-11 and Kepler-63 for which the degeneracy on i* is broken and favors the configuration where their south pole is visible. The stellar equator, plotted as a solid black line, is shown only in systems where the stellar inclination (and thus the 3D spin-orbit angle) is constrained. The stellar disk is colored as a function of its surface RV field. The normal to the planetary orbital plane is shown as a green arrow extending from the star center. The green solid curve represents the best-fit orbital trajectory. The thinner lines surrounding it show orbits obtained for orbital inclination, semi-major axis, and sky-projected spin-orbit angle values drawn randomly within 1 σ from their probability distributions. The star, planet (black disk), and orbit are to scale for a given system.
Current usage metrics show cumulative count of Article Views (full-text article views including HTML views, PDF and ePub downloads, according to the available data) and Abstracts Views on Vision4Press platform.
Data correspond to usage on the plateform after 2015. The current usage metrics is available 48-96 hours after online publication and is updated daily on week days.
Initial download of the metrics may take a while.