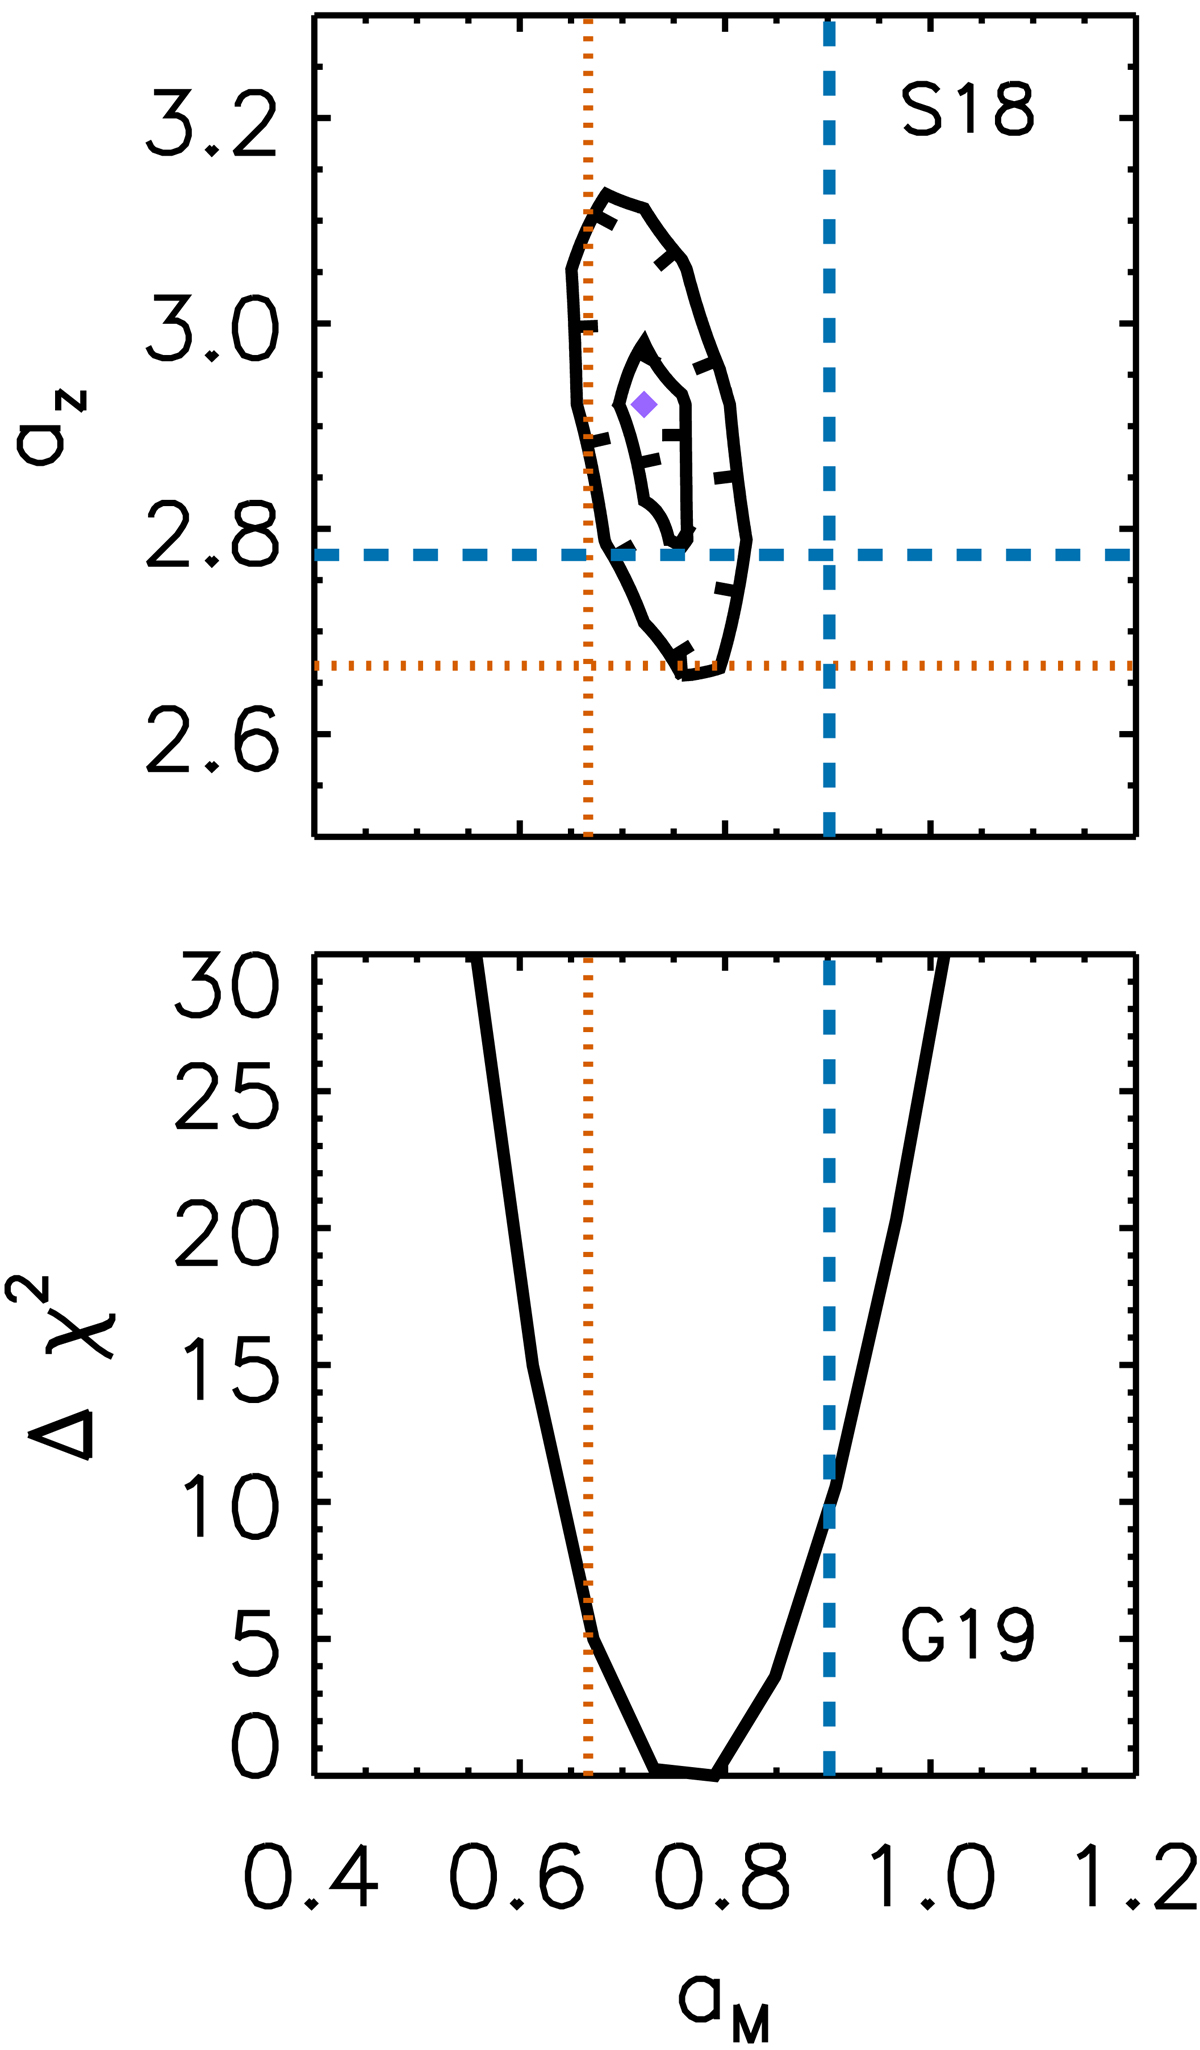
Fig. A.1.
Download original image
Constraints on the exponents aM and az in ![]() based upon the gas density and temperature profiles in S18 (top panel; likelihood contour at 1 and 5σ equivalent to Δχ2 of 6.2 and 28.8 for 2 degrees of freedom, respectively) and G19a (bottom panel; on aM only, because all the 12 objects have a redshift < 0.1. For the sake of comparison, 5σ corresponds to Δχ2 of 25.0 for 1 degree of freedom). The dotted red lines are the predicted self-similar slopes, and the dashed blue lines correspond to the expected slopes from the i(cm)z model.
based upon the gas density and temperature profiles in S18 (top panel; likelihood contour at 1 and 5σ equivalent to Δχ2 of 6.2 and 28.8 for 2 degrees of freedom, respectively) and G19a (bottom panel; on aM only, because all the 12 objects have a redshift < 0.1. For the sake of comparison, 5σ corresponds to Δχ2 of 25.0 for 1 degree of freedom). The dotted red lines are the predicted self-similar slopes, and the dashed blue lines correspond to the expected slopes from the i(cm)z model.
Current usage metrics show cumulative count of Article Views (full-text article views including HTML views, PDF and ePub downloads, according to the available data) and Abstracts Views on Vision4Press platform.
Data correspond to usage on the plateform after 2015. The current usage metrics is available 48-96 hours after online publication and is updated daily on week days.
Initial download of the metrics may take a while.