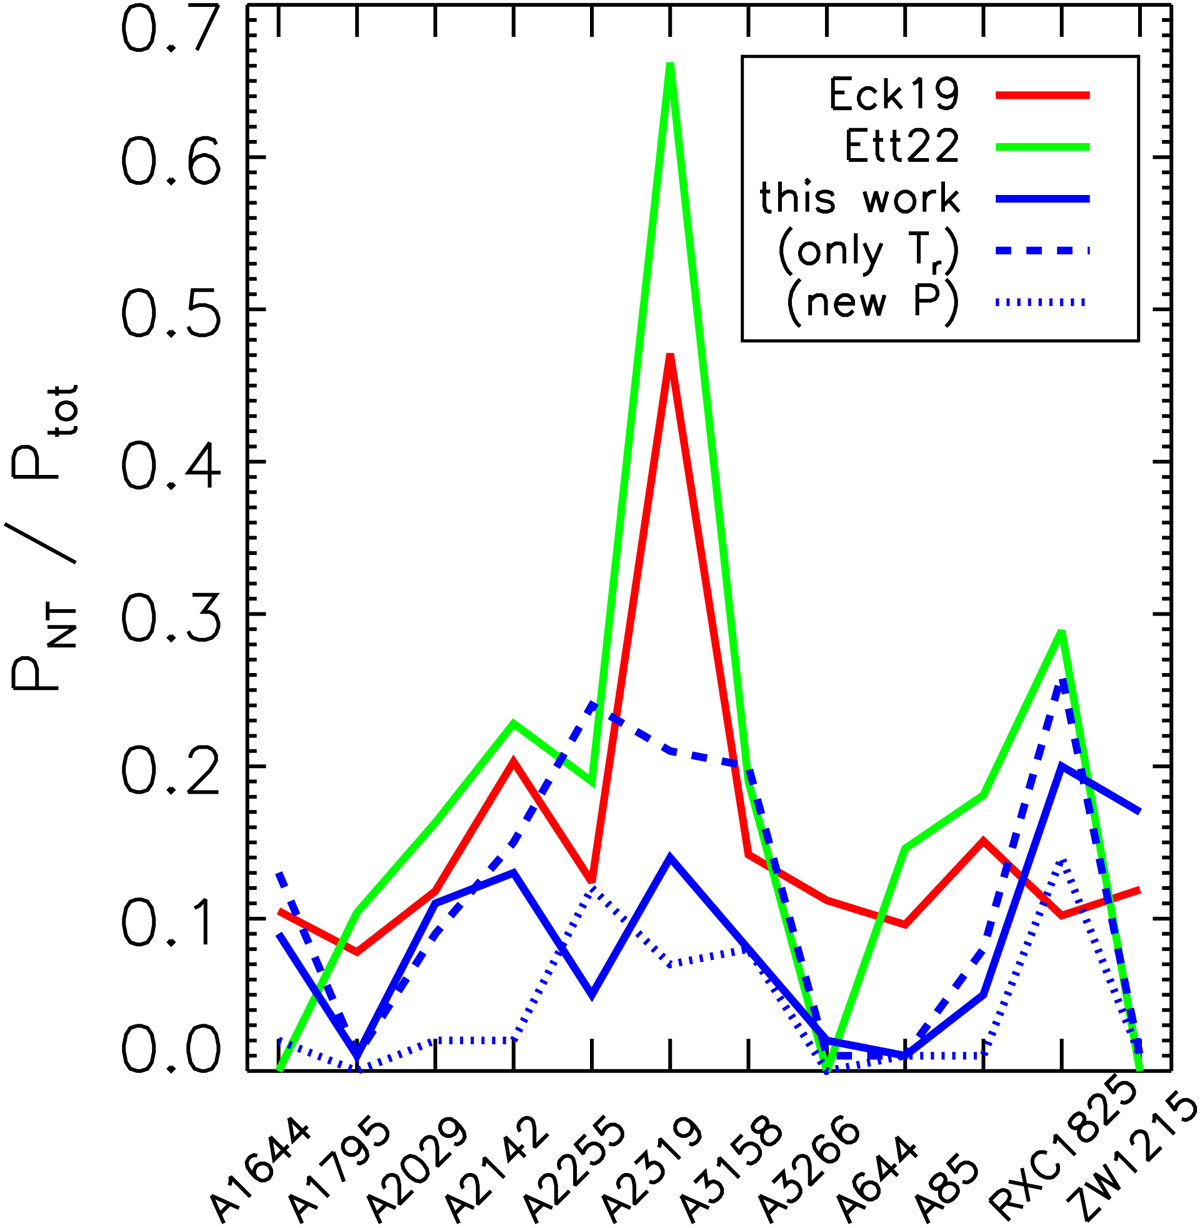
Fig. 7.
Download original image
Predicted 1σ upper limits on the value of the hydrostatic bias b here represented as the ratio between the nonthermal (PNT) and total (Ptot) pressure in the ICM (b = PNT/Ptot; see e.g., Eckert et al. 2019; Ettori & Eckert 2022). The dashed line represents the upper limit when only the temperature profile was used in the likelihood; when the new universal pressure profile also formed X-COP data (see Appendix B), the upper limits indicated with a dotted line were obtained. We note that the high level of nonthermal pressure support required for A2319 is explained by the ongoing merger described in Ghirardini et al. (2018).
Current usage metrics show cumulative count of Article Views (full-text article views including HTML views, PDF and ePub downloads, according to the available data) and Abstracts Views on Vision4Press platform.
Data correspond to usage on the plateform after 2015. The current usage metrics is available 48-96 hours after online publication and is updated daily on week days.
Initial download of the metrics may take a while.