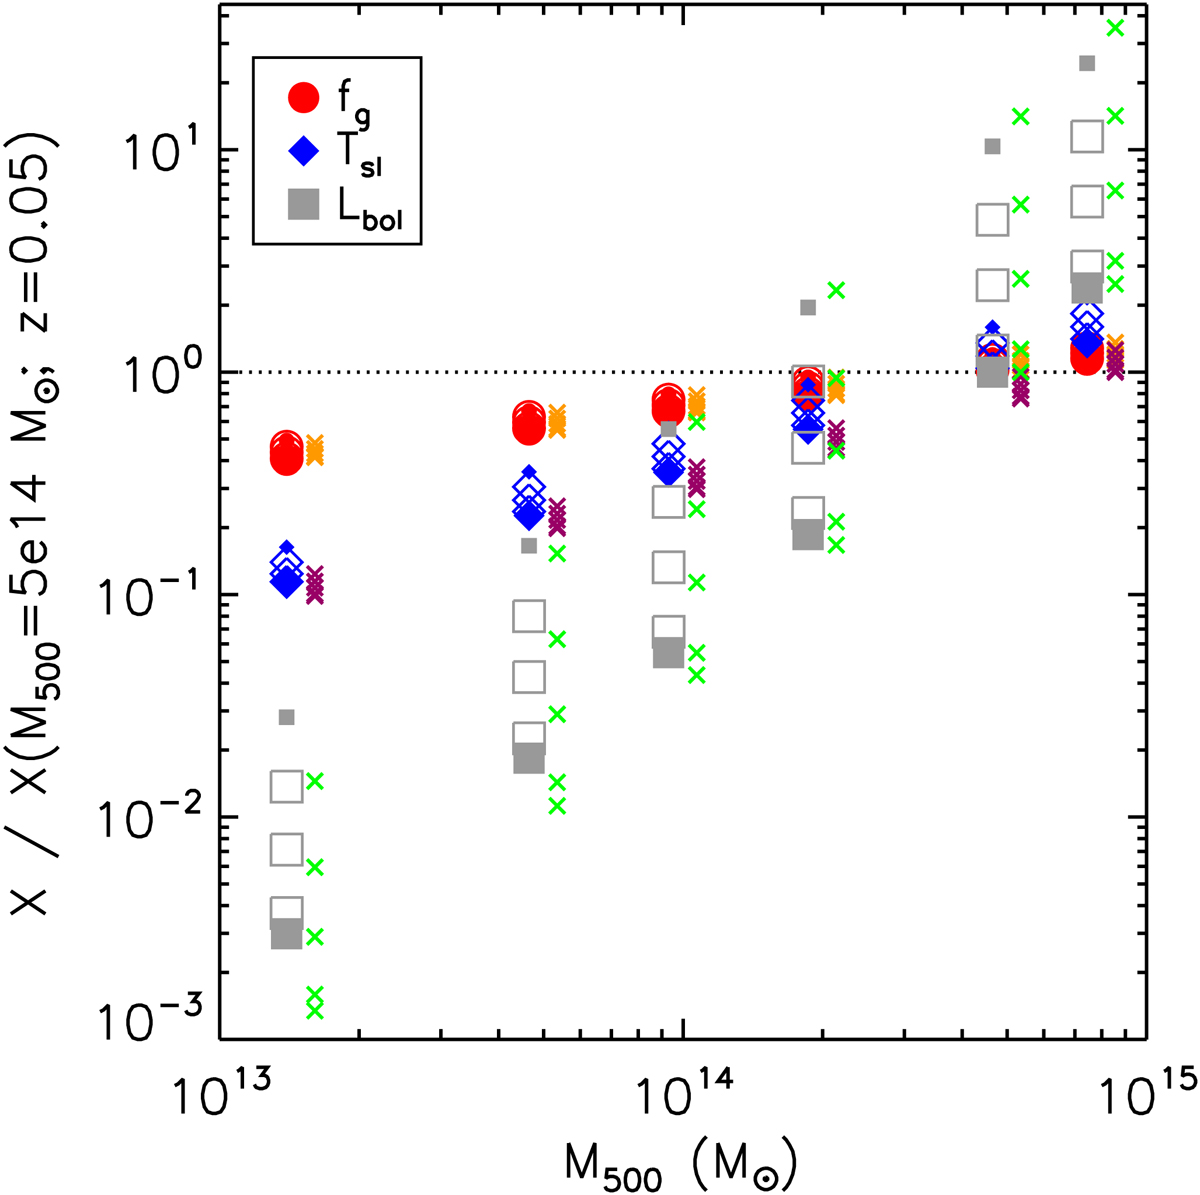
Fig. 5.
Download original image
Comparison between some interesting global values X (hydrostatic mass, spectroscopic-like temperature, bolometric luminosity, and gas mass fraction) estimated from the i(cm)z model and the predicted revised scaling laws (see Eqs. (6)). For each quantity X, we plot the value normalized at (M500, z) = (5 × 10¹⁴ M⊙, 0.05) and estimated at Δ = 500 estimated for the grids of M500/1014 M⊙ = [0.15, 0.5, 1, 2, 5, 8] and redshift [0.05, 0.2, 0.6, 1, 1.5]. Filled dots indicate the estimates at the extreme of the redshift distribution, with the smallest dots corresponding to the highest z. The crosses show the predicted values from the revised scaling laws (orange, fg; purple, Tsl; and green, Lbol).
Current usage metrics show cumulative count of Article Views (full-text article views including HTML views, PDF and ePub downloads, according to the available data) and Abstracts Views on Vision4Press platform.
Data correspond to usage on the plateform after 2015. The current usage metrics is available 48-96 hours after online publication and is updated daily on week days.
Initial download of the metrics may take a while.