Fig. 4.
Download original image
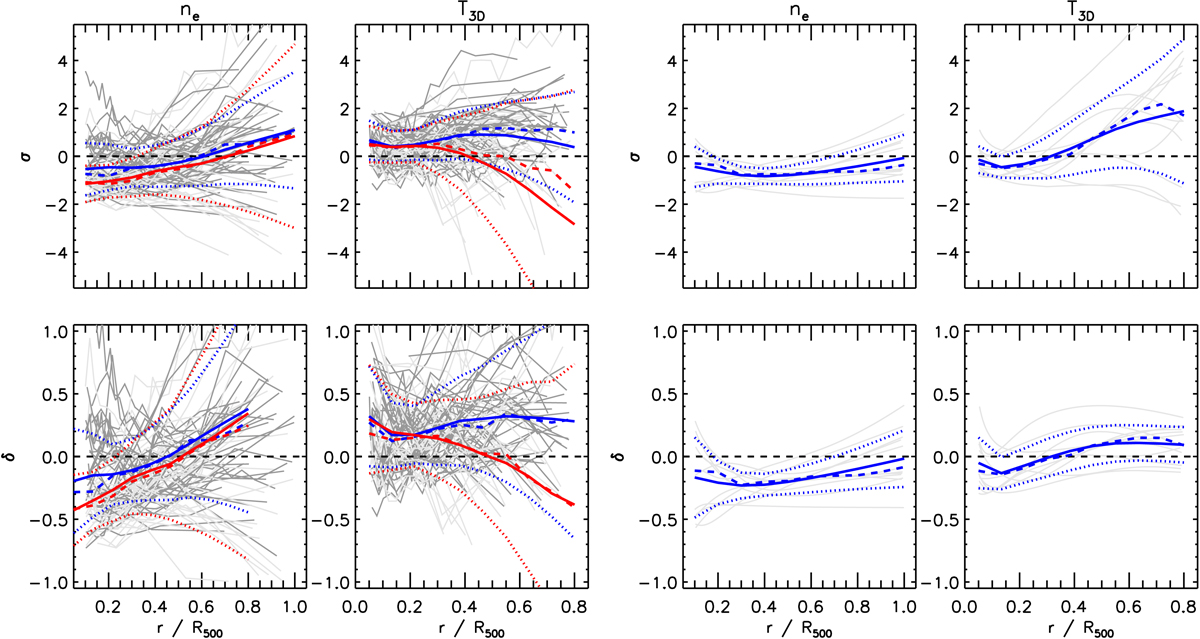
Differences between the predicted and observed gas density and temperature profiles using the datasets from S18 (four panels on the left) and G19a (four panels on the right). Top panels: deviations in terms of σ = (O − M)/ϵ, where O is the observed profile with error ϵO and M is the predicted value with an estimated uncertainty of ϵM (see Fig. 3) that combines in quadrature with ϵO to produce the total error ϵ. Bottom panels: systematic deviation δ = (O − M)/M. Grey lines represent the single object; solid, dashed, and dotted lines indicate mean, median, and scatter, respectively. In the four panels on the left, blue and red lines correspond to the properties of the subsamples at z < 0.6 and z > 0.6, respectively.
Current usage metrics show cumulative count of Article Views (full-text article views including HTML views, PDF and ePub downloads, according to the available data) and Abstracts Views on Vision4Press platform.
Data correspond to usage on the plateform after 2015. The current usage metrics is available 48-96 hours after online publication and is updated daily on week days.
Initial download of the metrics may take a while.