Fig. 3.
Download original image
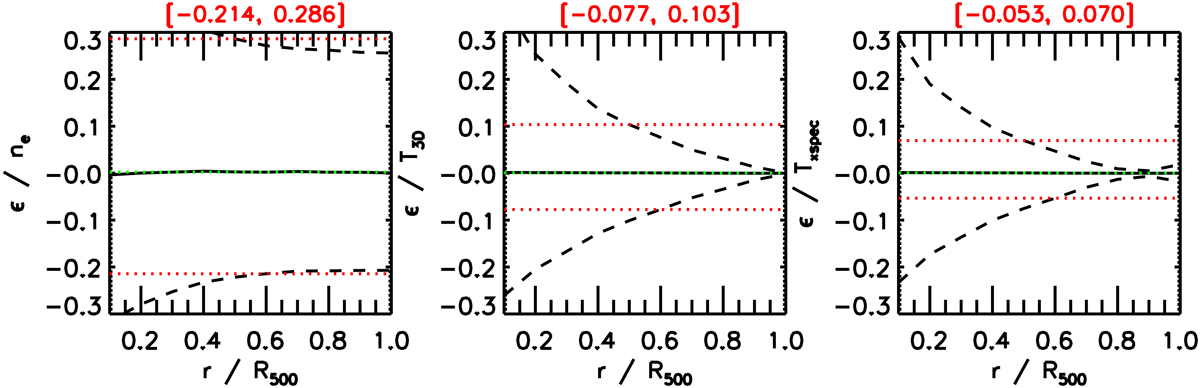
Radial profiles of the relative uncertainties (ϵ/Y − 1) on (left) gas density, (center) 3D gas temperature, and (right) projected spectroscopic-like temperature due to (i) the errors on the assumed parameters that describe the mass dependence, (ii) the scatter in the c − M − z relation, and (iii) the intrinsic scatter on the “universal” pressure profile. Red (green) dotted lines indicate the median values of the 16th and 84th percentiles (and of the medians) estimated at each radius. The case refers to the input values (M500, z) = (4.6 × 10¹⁴ M⊙, 0.6), which represents the median values of the S18 sample.
Current usage metrics show cumulative count of Article Views (full-text article views including HTML views, PDF and ePub downloads, according to the available data) and Abstracts Views on Vision4Press platform.
Data correspond to usage on the plateform after 2015. The current usage metrics is available 48-96 hours after online publication and is updated daily on week days.
Initial download of the metrics may take a while.