Fig. 1.

Download original image
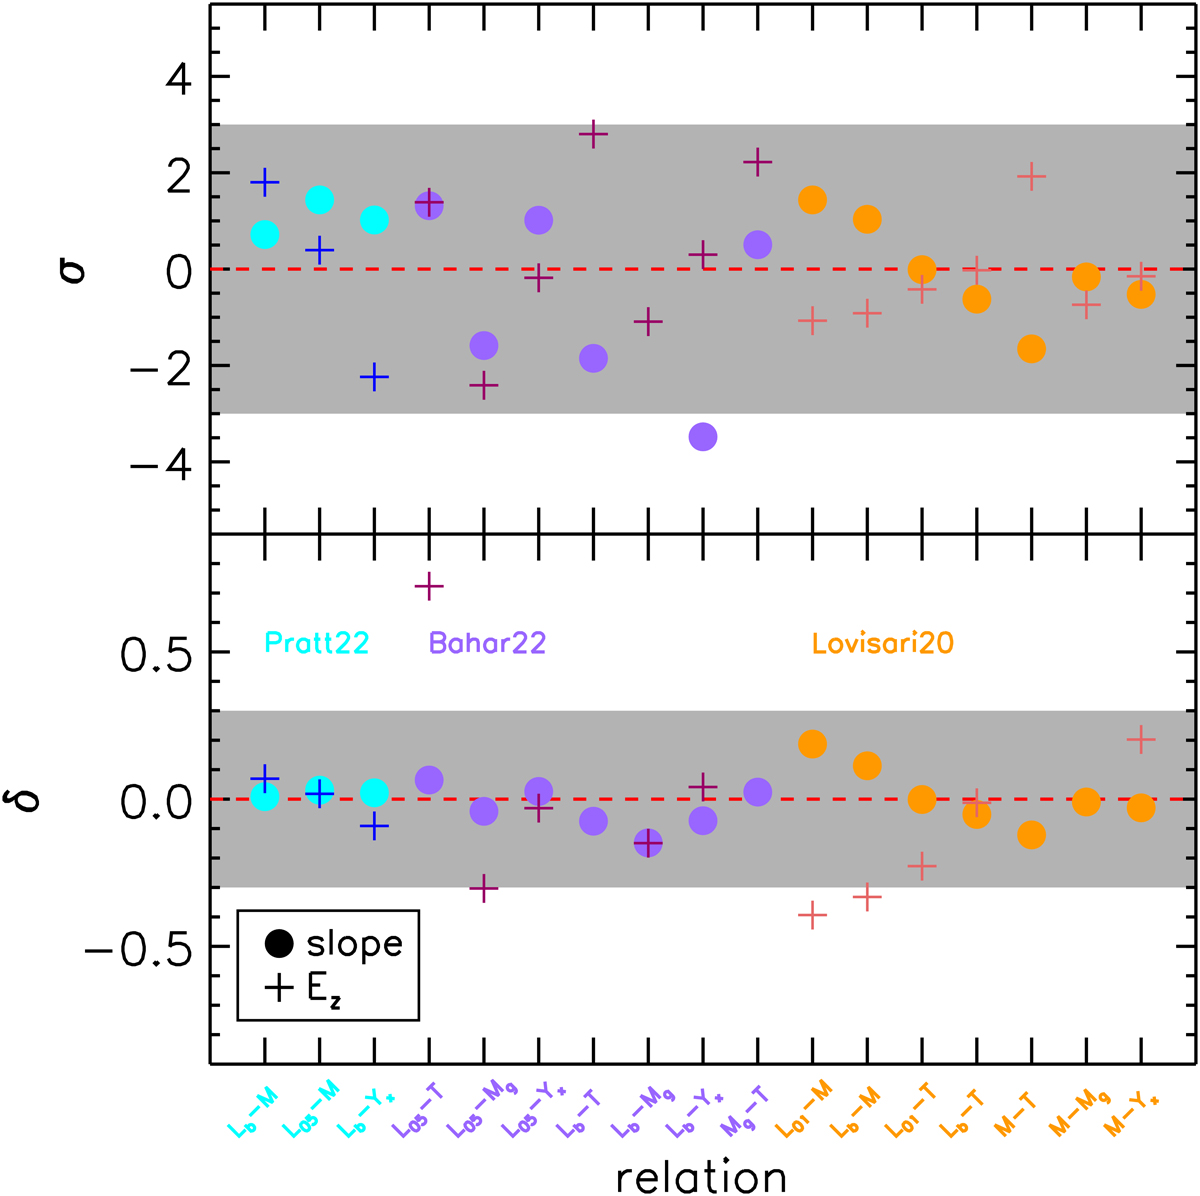
Differences between the predicted and observed values of the slope (filled circle) and the redshift dependence (cross) of the listed scaling relations. Top panel: Deviations in terms of σ = (O − M)/ϵO, where O is the estimate constrained from the observations with error ϵO and M is the predicted value; bottom panel: systematic deviation δ = (O − M)/M. Shaded regions represent [ − 3, +3] σ and [ − 0.3, +0.3] δ in the top and bottom panel, respectively. Labels indicate the following: luminosity, either bolometric (Lb) or in bands (0.5–2 keV, L05; 0.1–2.4 keV, L01); total (M) and gas (Mg) mass; and temperature T and X-ray Yx = Mg T.
Current usage metrics show cumulative count of Article Views (full-text article views including HTML views, PDF and ePub downloads, according to the available data) and Abstracts Views on Vision4Press platform.
Data correspond to usage on the plateform after 2015. The current usage metrics is available 48-96 hours after online publication and is updated daily on week days.
Initial download of the metrics may take a while.


