Fig. 6
Download original image
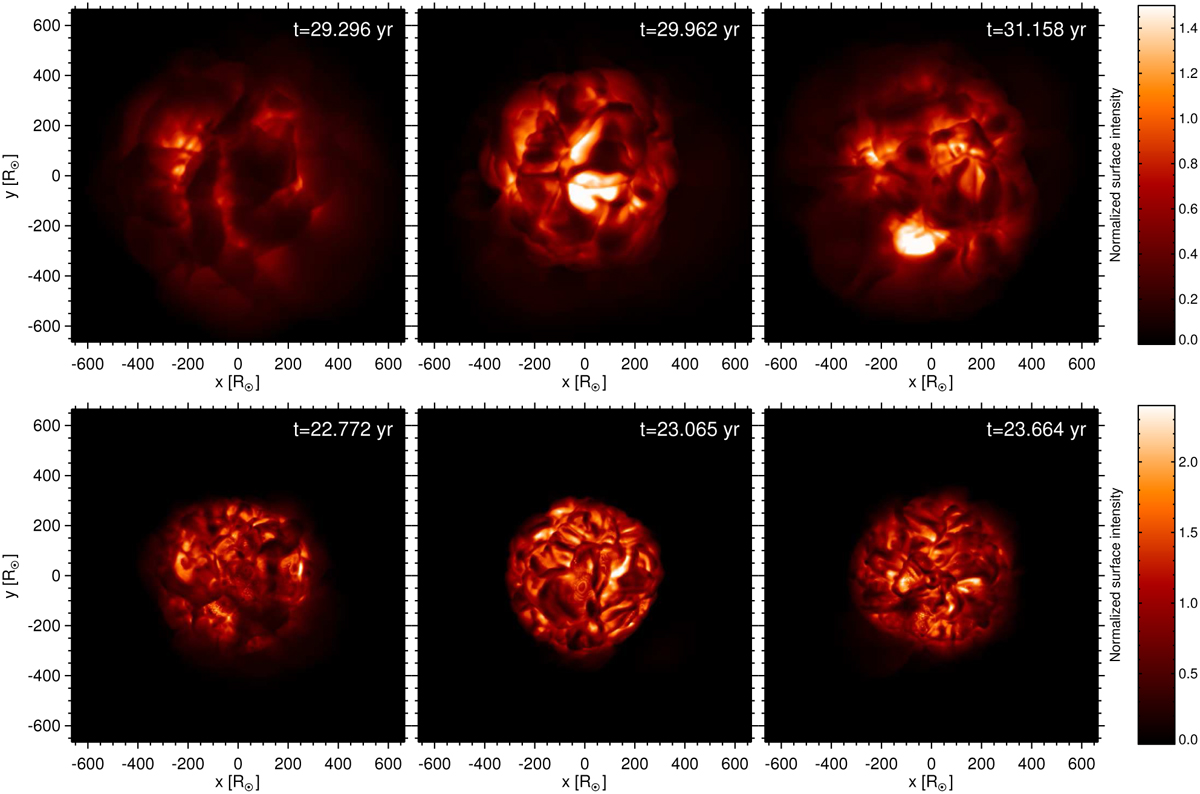
Time sequences of bolometric surface intensity for the large 1 M⊙ model st28gm06n052 (snapshots about 8 and 14 months apart, see the counter at the top of the panels) and the 1.5 M⊙ model st28gm05n033 (snapshots about 3.5 and 7 months apart). Only the inner part of computational box that contains the star is plotted, on the same scale for both models.
Current usage metrics show cumulative count of Article Views (full-text article views including HTML views, PDF and ePub downloads, according to the available data) and Abstracts Views on Vision4Press platform.
Data correspond to usage on the plateform after 2015. The current usage metrics is available 48-96 hours after online publication and is updated daily on week days.
Initial download of the metrics may take a while.