Fig. 5
Download original image
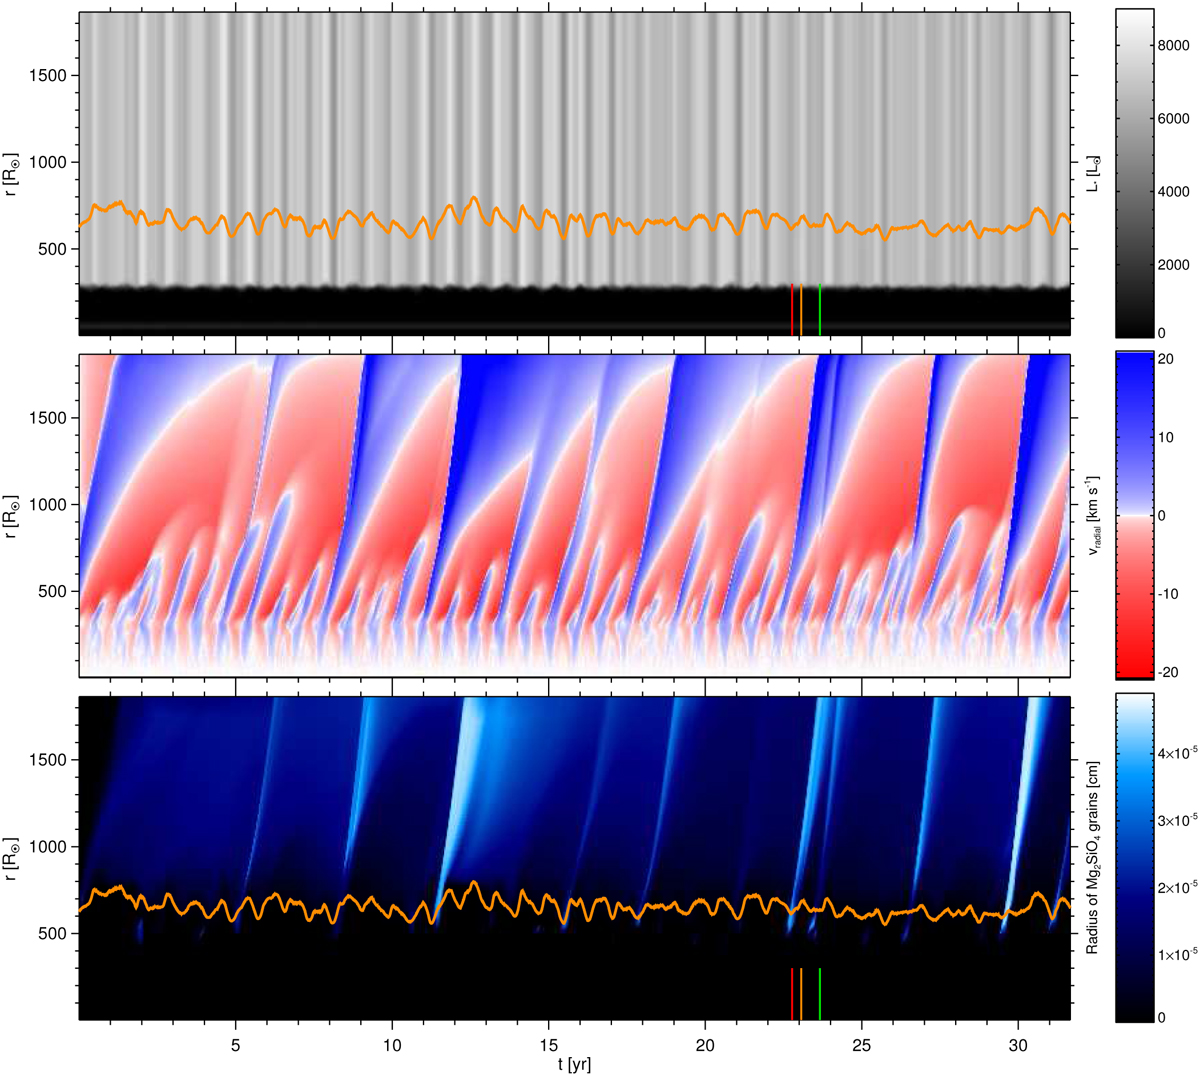
Spherical averages of luminosity (integrated radiative flux), radial velocity, and grain radius in the 1.5 M⊙ model st28gm05n033, as a function of radial distance and time. In the top and bottom panels, an isotherm with a temperature representative of silicate condensation is shown (1150 K) to demonstrate the interplay between variable radiative heating and the inner edges of dust layers. The red, orange, and green vertical bars indicate the instants selected for Figs. 3 and 6. The dark area in the lower part of the top panel represents the deep stellar interior, where most of the energy flux is transported by convection. The plots are similar to the corresponding ones in Fig 4. However, it is important to note the differing spatial and temporal axes, and the different range in grain radii.
Current usage metrics show cumulative count of Article Views (full-text article views including HTML views, PDF and ePub downloads, according to the available data) and Abstracts Views on Vision4Press platform.
Data correspond to usage on the plateform after 2015. The current usage metrics is available 48-96 hours after online publication and is updated daily on week days.
Initial download of the metrics may take a while.