Open Access
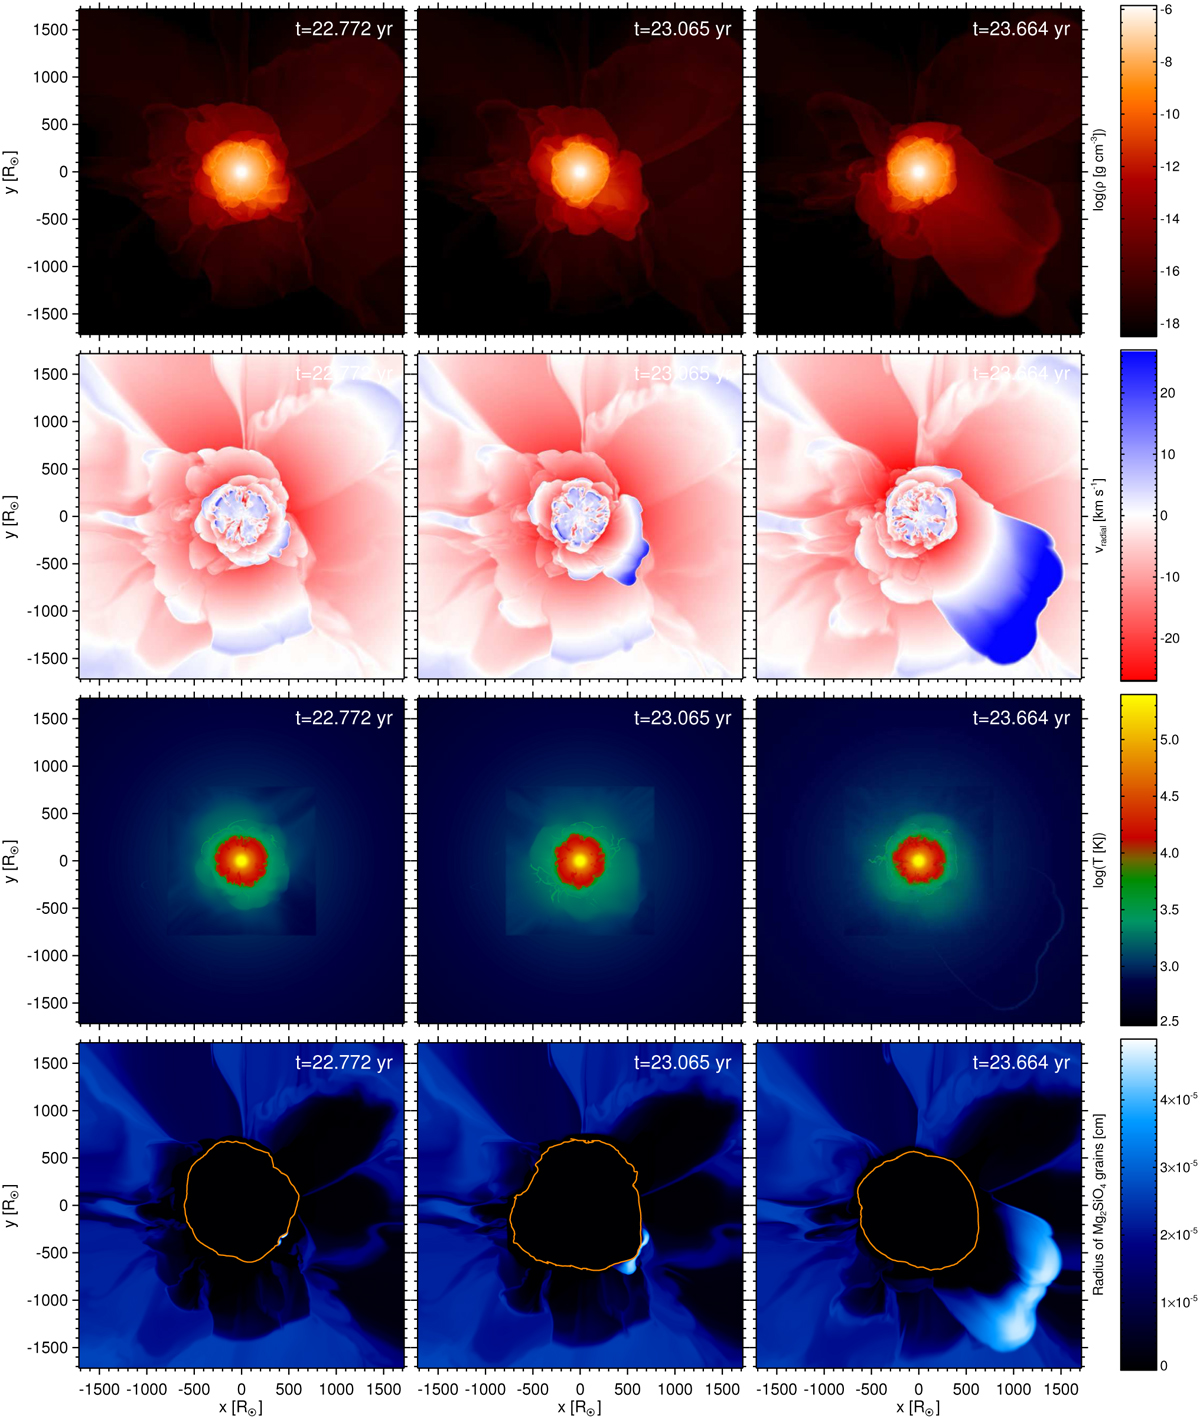
Fig. 3
Download original image
Time sequences of density, radial velocity, temperature, and silicate grain radius for a slice through the center of the 1.5 M⊙ model st28gm05n033. The snapshots are about 3.5 and 7 months apart, respectively (see the counter at the top of the panels). The orange line in the bottom panels indicates an isotherm of 1150 K.
Current usage metrics show cumulative count of Article Views (full-text article views including HTML views, PDF and ePub downloads, according to the available data) and Abstracts Views on Vision4Press platform.
Data correspond to usage on the plateform after 2015. The current usage metrics is available 48-96 hours after online publication and is updated daily on week days.
Initial download of the metrics may take a while.