Fig. 1
Download original image
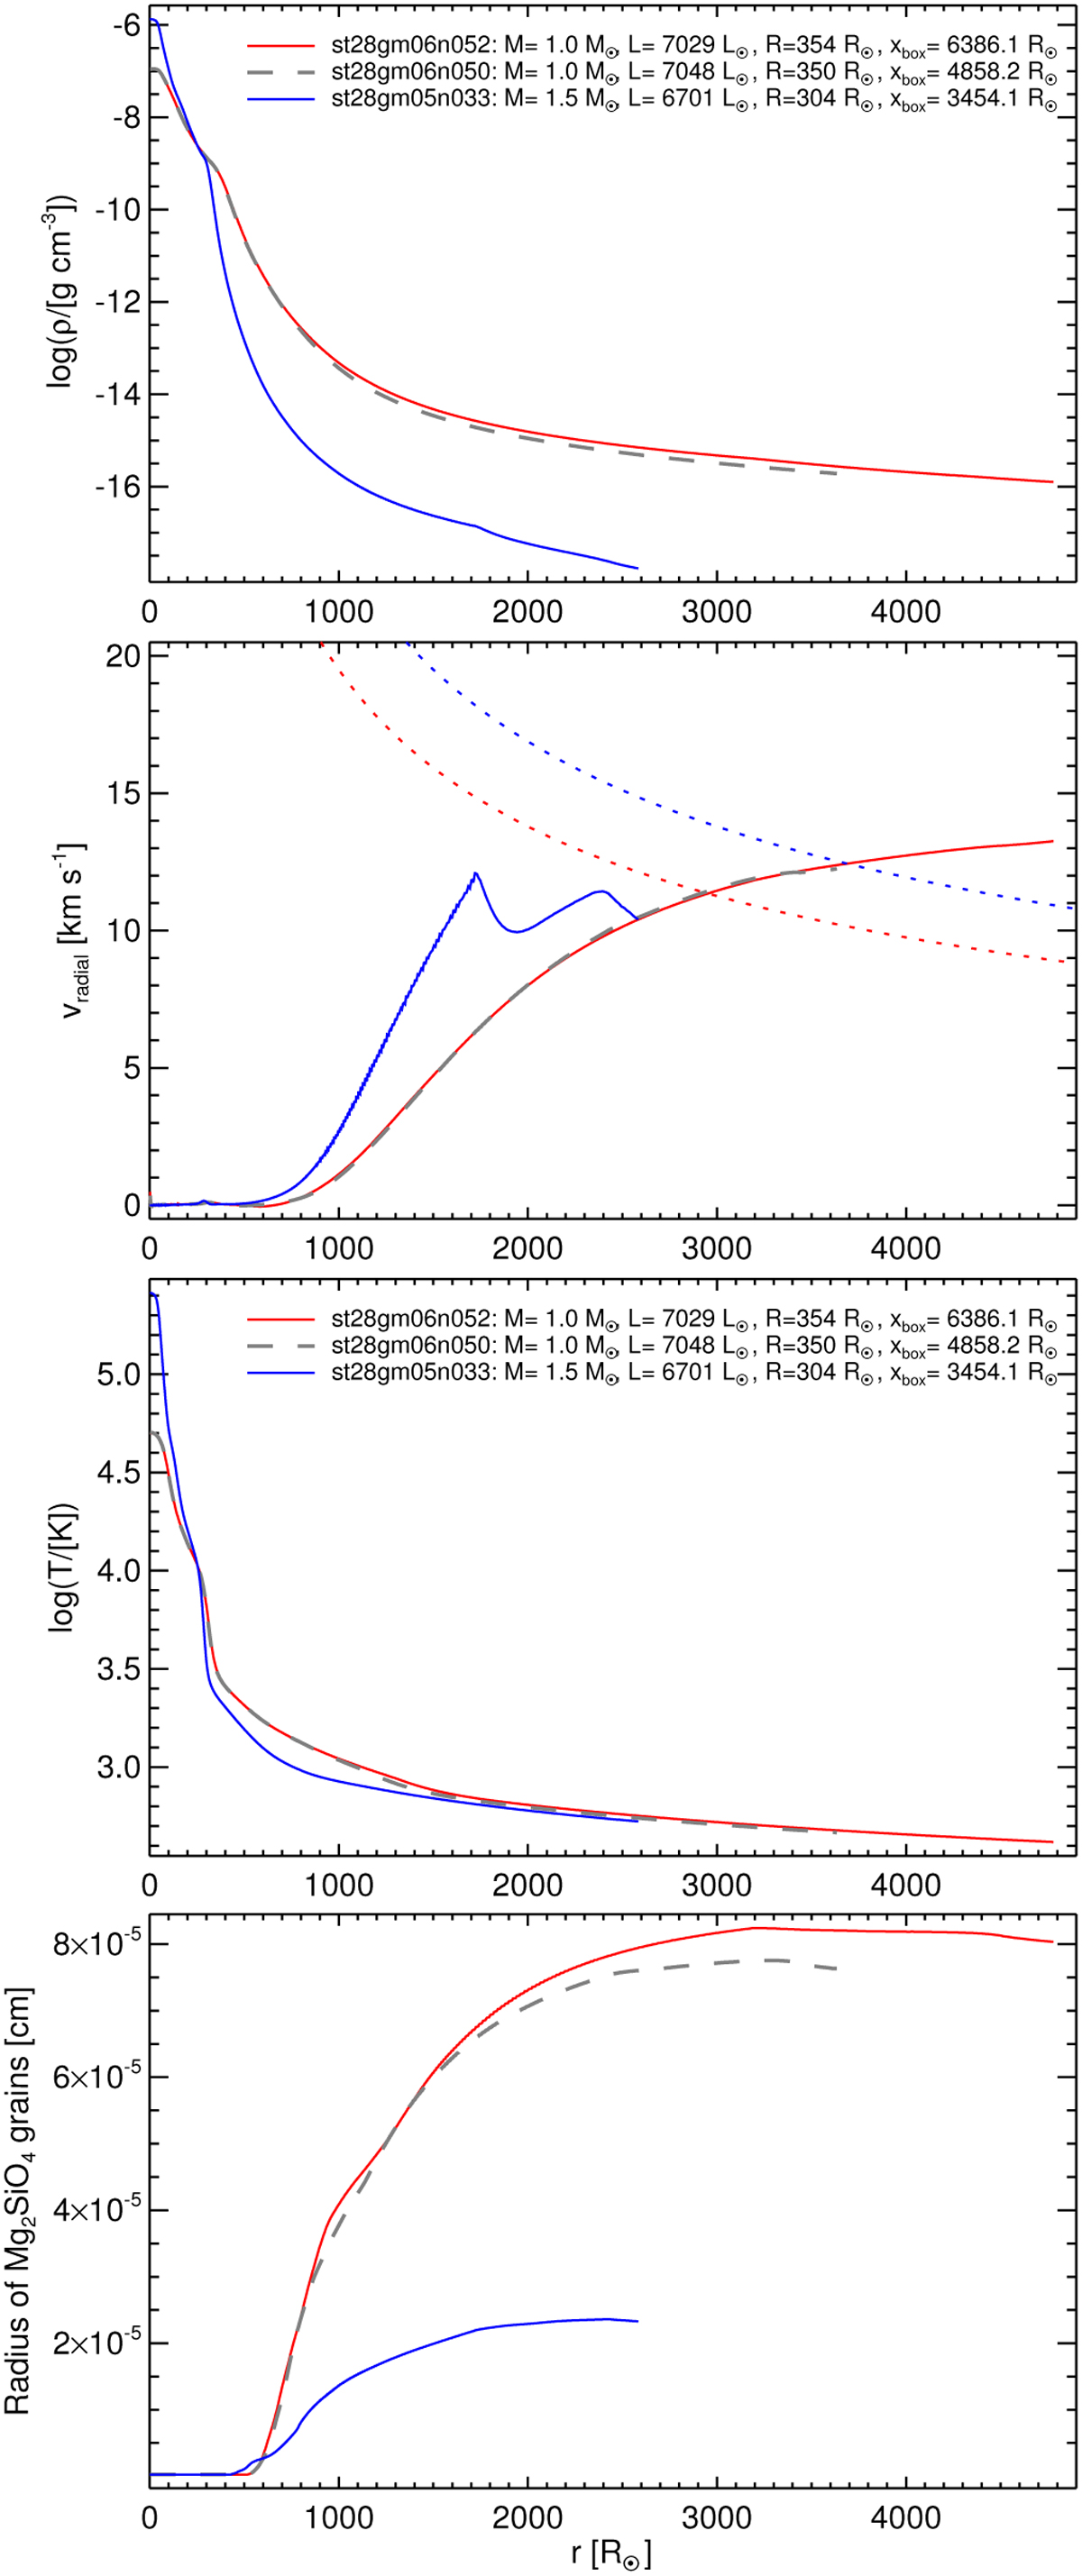
Mean radial structures of the models st28gm06n050 (dashed black curves), st28gm06n052 (red curves), and st28gm05n033 (blue curves). Shown are gas density, radial velocity, temperature, and silicate grain radius, averaged over spherical shells and time, and plotted against the distance from the stellar center. Averages are not only taken over spheres that fit completely into the cubical computational box, but also over partial spheres somewhat beyond, up to 1.5 × xouterbox/2, omitting the regions close to the corners of the cube. The dotted red and blue curves in the radial-velocity panel represent the escape velocity as a function of distance for stellar masses of 1 M⊙ and 1.5 M⊙, respectively. For details, see Sects. 2.5 and 3.
Current usage metrics show cumulative count of Article Views (full-text article views including HTML views, PDF and ePub downloads, according to the available data) and Abstracts Views on Vision4Press platform.
Data correspond to usage on the plateform after 2015. The current usage metrics is available 48-96 hours after online publication and is updated daily on week days.
Initial download of the metrics may take a while.