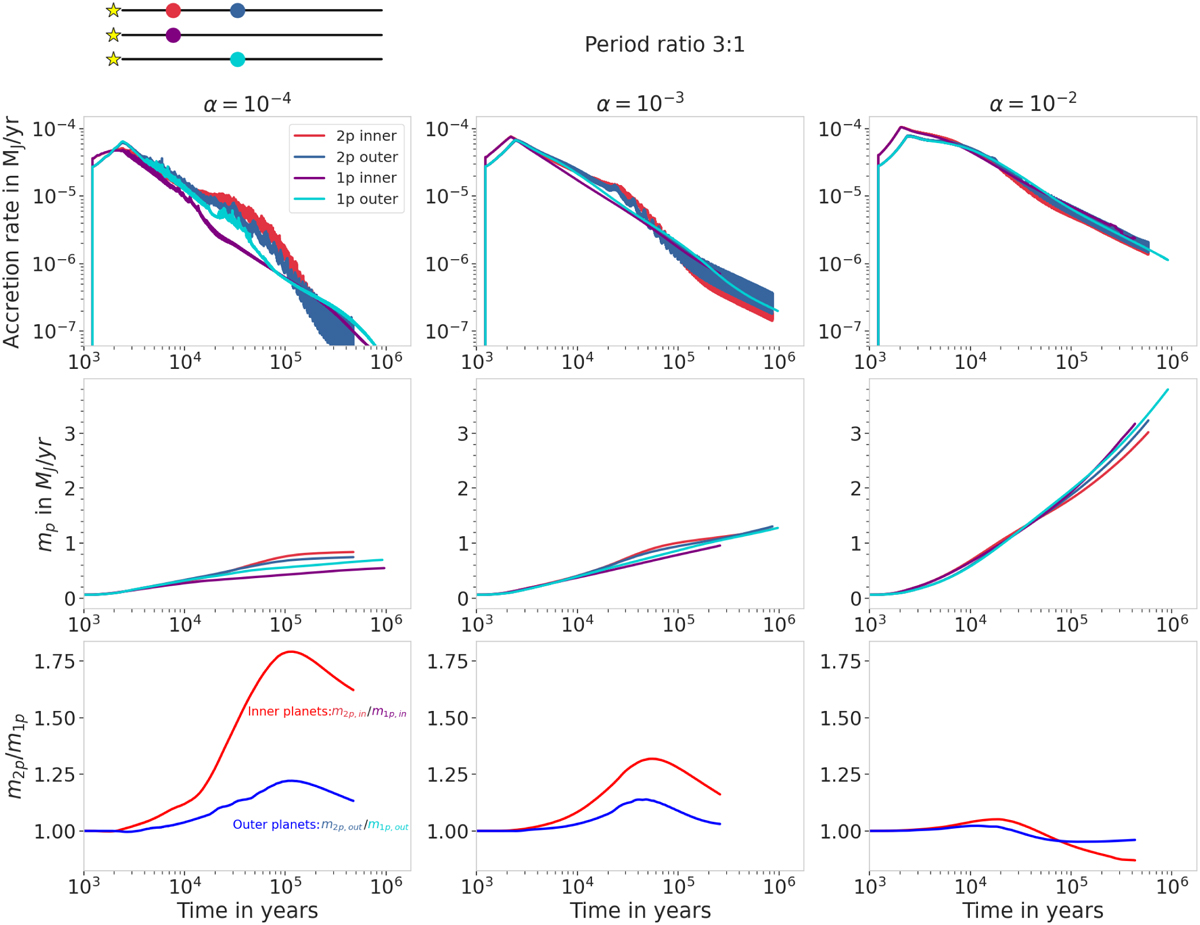
Fig. 5
Download original image
Comparison between single accreting planets and two simultaneously accreting planets. The planets are fixed at positions corresponding to the 3:1 period ratio. As in Figs. 1 and 2, the top row presents the accretion rates as a function of time and the middle row the planet masses. In the bottom row, we show the ratio of the masses in the single- and two-planet case: the red line represents the ratio of the inner planets (m2p,in/m1p,in), and the blue line represents the outer planets’ ratio (m2p,out/m1p,out). At low viscosity (left panels), the differences with the single-planet case originate from the additional formation of vortices in between the planets, which enhances the accretion rates during the vortex lifetimes. At high viscosity (right panel), while the outer planet is slightly impacted by the presence of the inner planet, we observe the starvation of the inner planet. We expect to see similar behavior at lower viscosities but delayed in time, due to longer viscosity timescales.
Current usage metrics show cumulative count of Article Views (full-text article views including HTML views, PDF and ePub downloads, according to the available data) and Abstracts Views on Vision4Press platform.
Data correspond to usage on the plateform after 2015. The current usage metrics is available 48-96 hours after online publication and is updated daily on week days.
Initial download of the metrics may take a while.