Fig. 3
Download original image
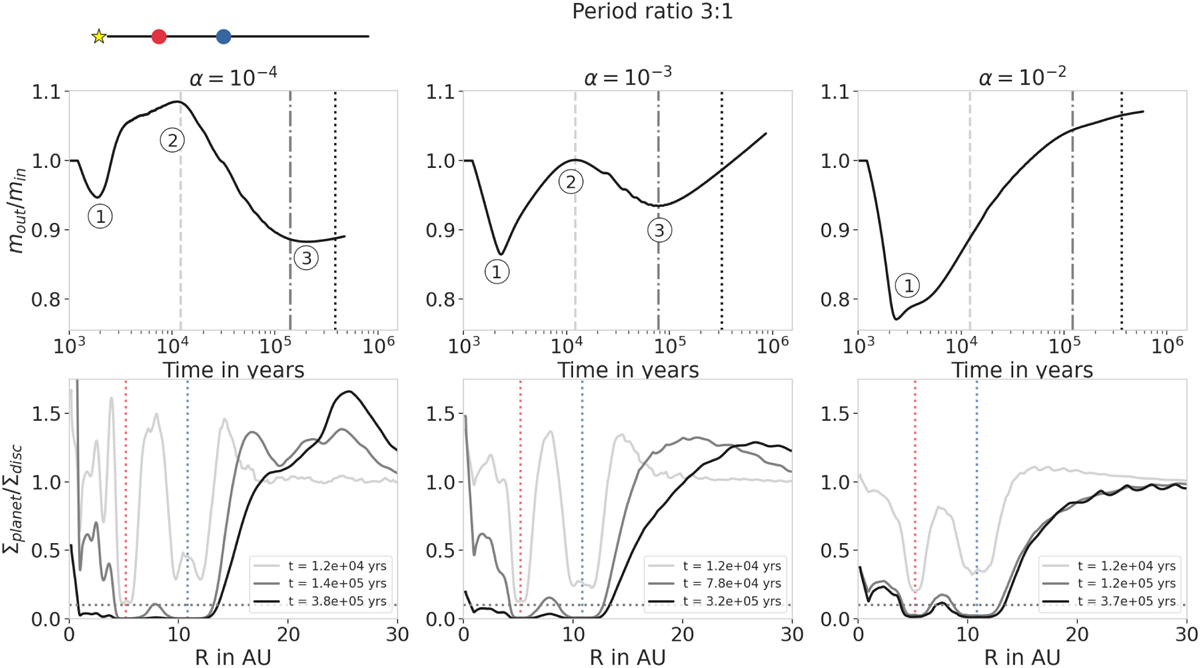
Mass ratio (top row) and perturbed surface density proflies (bottom row) as a function of time for different α-viscosities. As in Fig. 1, the planets are fixed at the 3:1 period ratio positions, represented by the two vertical dotted lines in the bottom row. The horizontal dotted lines in the bottom panels mark the ∑planet/∑disk = 0.1 threshold, where we consider that a gap is opened (Crida et al. 2006). In the top panels, a decreasing (respectively increasing) mass ratio indicates that the inner (respectively outer) planet is accreting more than the other planet. Different flips are observed in the evolution of the mass ratios, marked in circled numbers. The color of the surface density profiles shown in the bottom row corresponds to the color of the different vertical lines in the top row and represents different times. The last snapshot of the perturbed surface density is taken 2.4 × 10⁵ yr (20 000 orbits of the inner planet) after the last mass ratio flip, shown by the vertical dotted black line. The first flip ① can be explained by the accretion formula itself (see Eq. (2)), while the other two flips correspond to the evolution of the surface density.
Current usage metrics show cumulative count of Article Views (full-text article views including HTML views, PDF and ePub downloads, according to the available data) and Abstracts Views on Vision4Press platform.
Data correspond to usage on the plateform after 2015. The current usage metrics is available 48-96 hours after online publication and is updated daily on week days.
Initial download of the metrics may take a while.