Open Access
Fig. 3.
Download original image
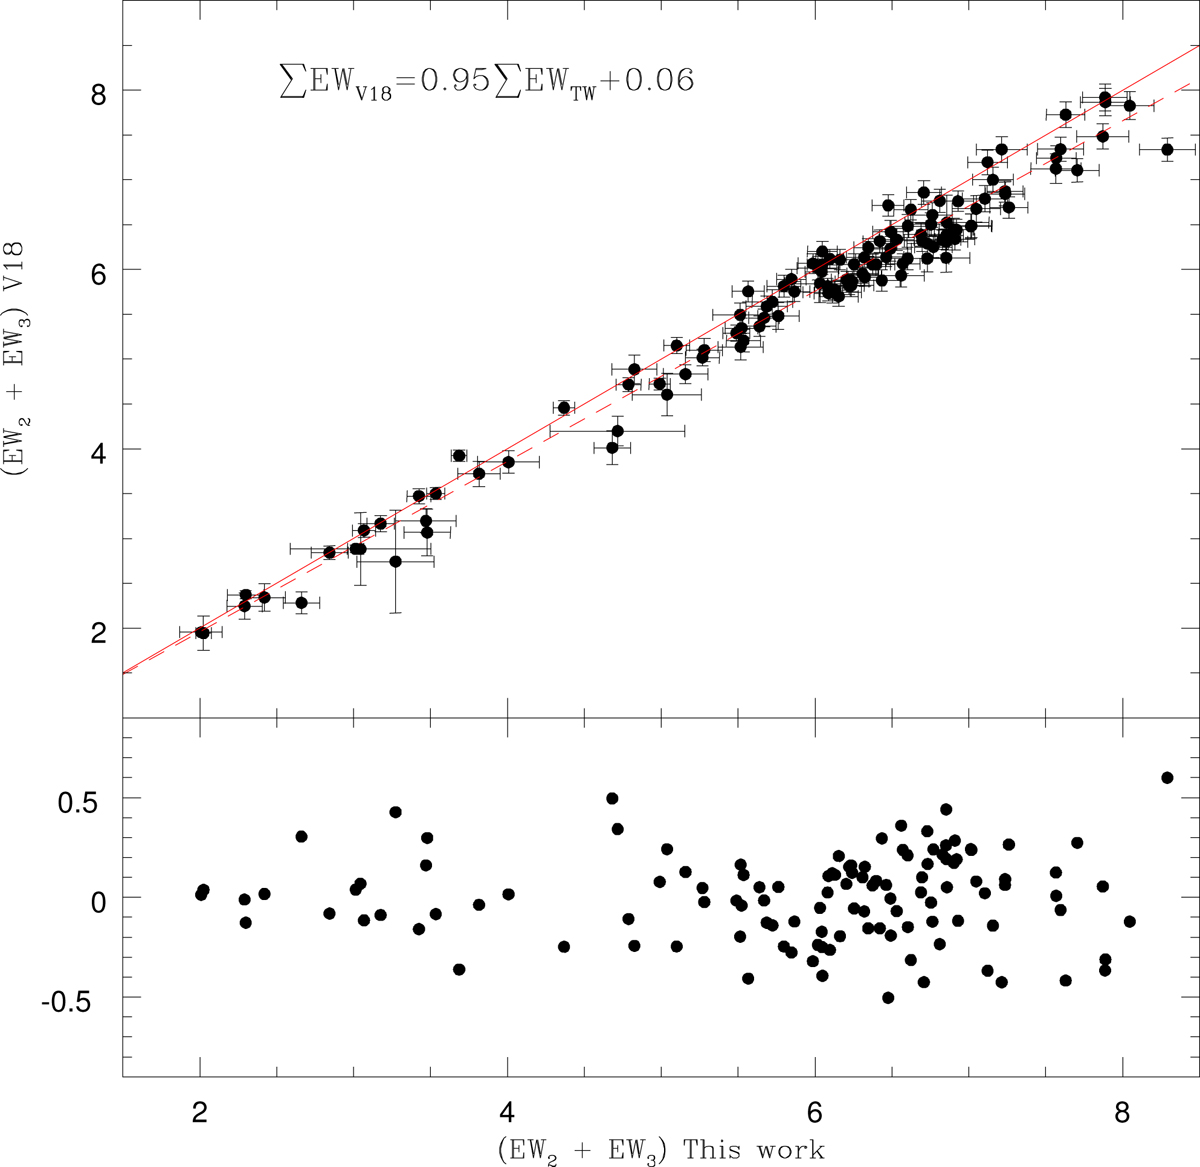
Sum of the EWs from the two strongest CaT lines (top panel), measured by us and by V18 (corrected to the S12 scale). The continuous line shows the one-to-one relation, while the dashed line shows the best-fit relation given by Eq. (1). Residuals of the comparison to the fit are shown in the bottom panel.
Current usage metrics show cumulative count of Article Views (full-text article views including HTML views, PDF and ePub downloads, according to the available data) and Abstracts Views on Vision4Press platform.
Data correspond to usage on the plateform after 2015. The current usage metrics is available 48-96 hours after online publication and is updated daily on week days.
Initial download of the metrics may take a while.