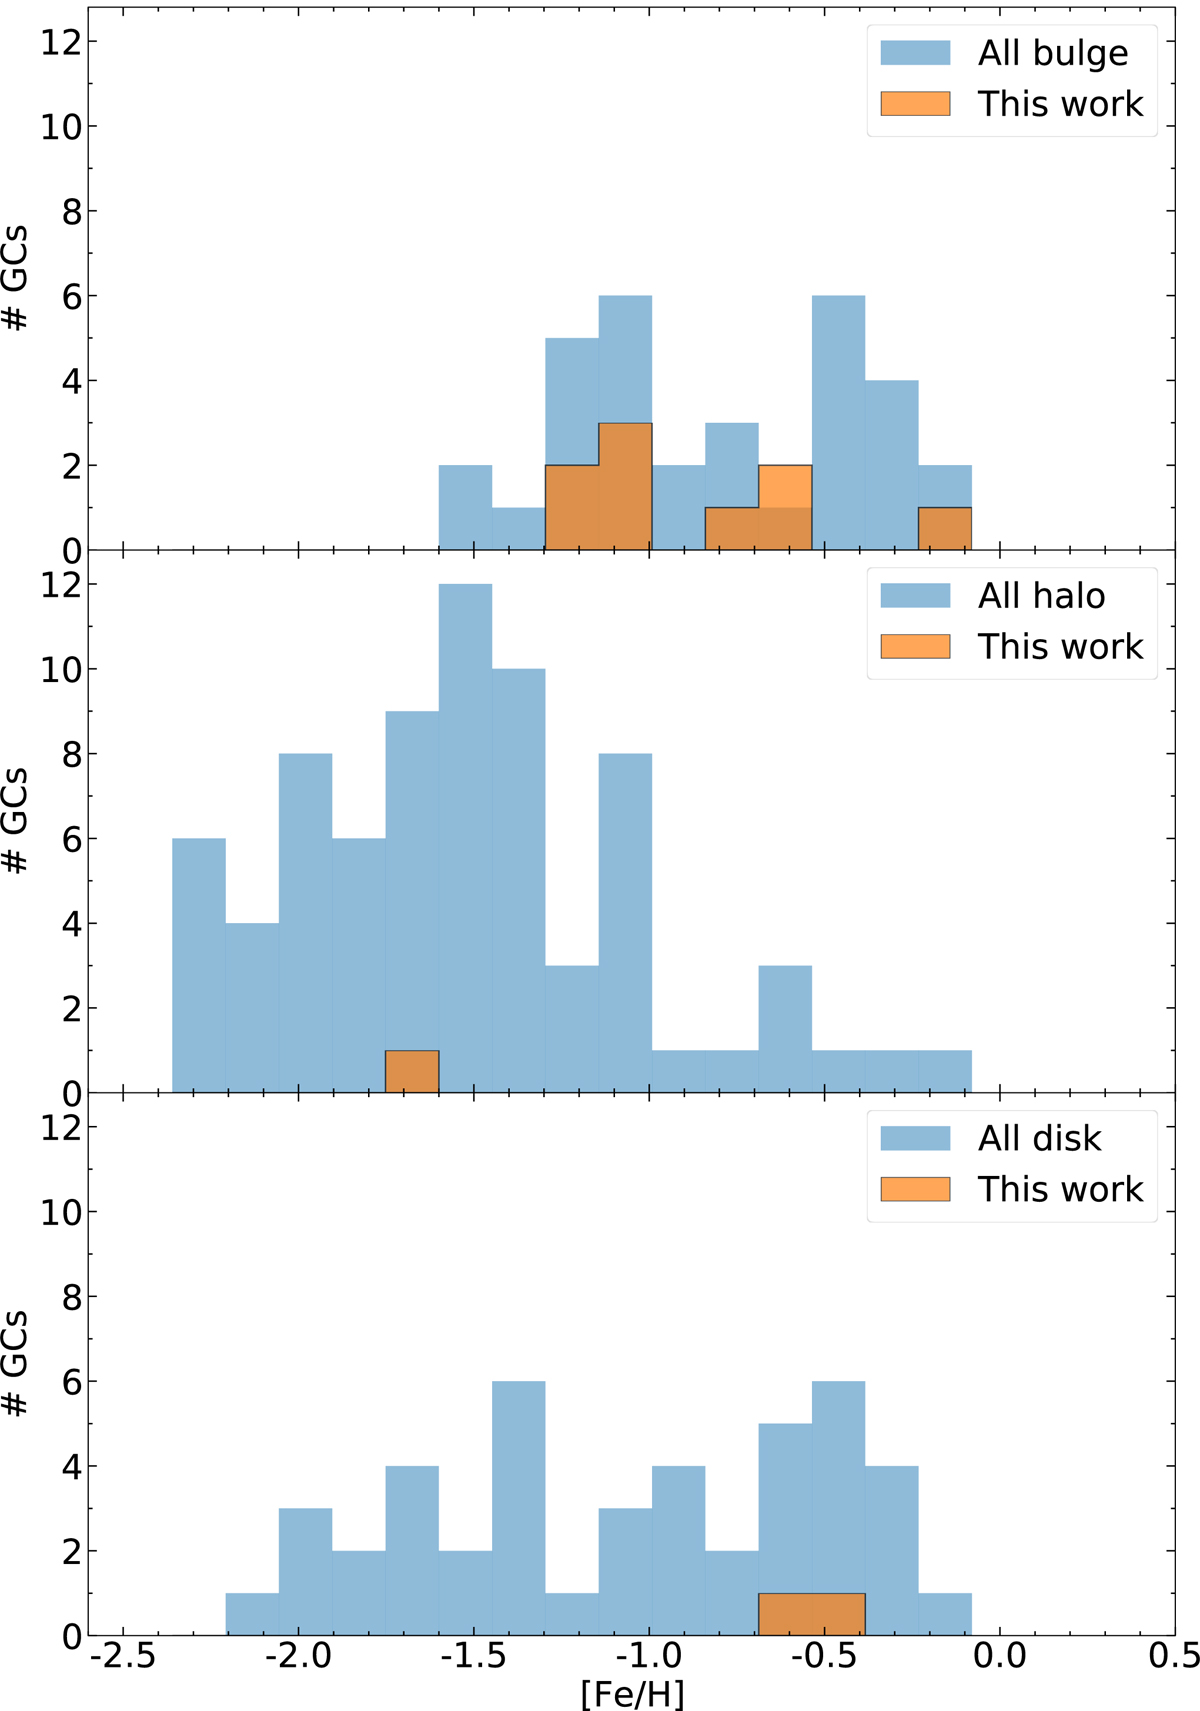
Fig. 10.
Download original image
Metallicity distribution function of all Galactic GCs from the metallicity scale of Dias et al. (2016a,b 2019 version) shown as a blue histogram split by population following the same classification adopted in Fig. 1. The orange histogram represents the respective GC samples analyzed in this work adopting the metallicities derived here applying the V18 scale, as shown in Table 3.
Current usage metrics show cumulative count of Article Views (full-text article views including HTML views, PDF and ePub downloads, according to the available data) and Abstracts Views on Vision4Press platform.
Data correspond to usage on the plateform after 2015. The current usage metrics is available 48-96 hours after online publication and is updated daily on week days.
Initial download of the metrics may take a while.