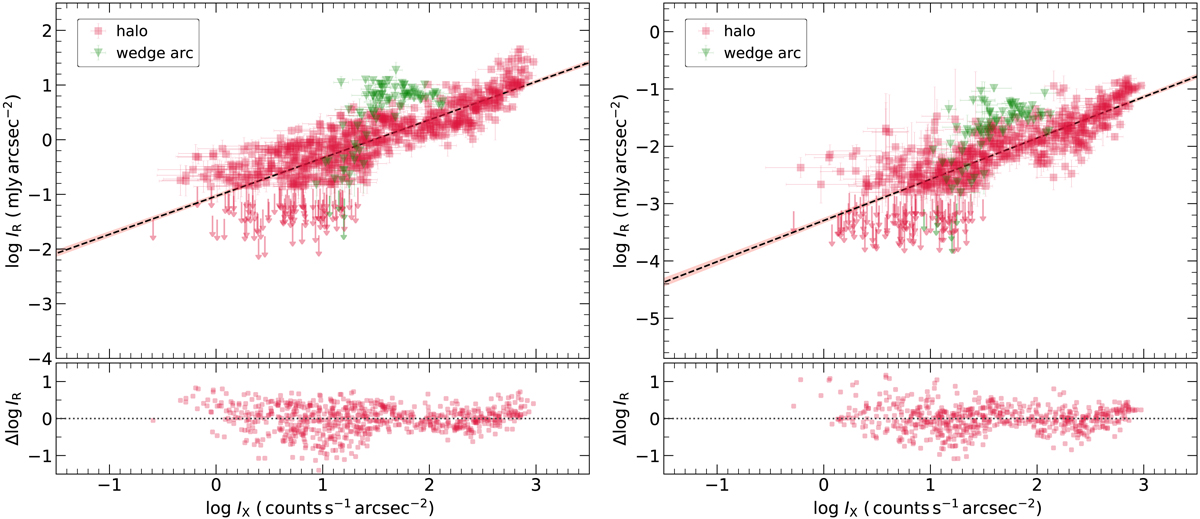
Fig. 9.
Download original image
Radio versus X-ray surface brightness correlation for the halo in Abell 2256 at 144 MHz (left) and 675 MHz (Right). Images and fitting is the same as in Fig. 8 but including all regions where both radio and X-ray surface brightness exceeds 2σ (emission below 3σ is shown as upper limits). Correlation between the radio and X-ray surface brightness across the halo region gets tighter when including all the halo emission at low frequencies. The best-fitted correlation slopes are b144 MHz = 0.87 ± 0.02, b675 MHz = 0.88 ± 0.03 in the halo region. The data points from the wedge arc are not scattered but are above the halo correlation.
Current usage metrics show cumulative count of Article Views (full-text article views including HTML views, PDF and ePub downloads, according to the available data) and Abstracts Views on Vision4Press platform.
Data correspond to usage on the plateform after 2015. The current usage metrics is available 48-96 hours after online publication and is updated daily on week days.
Initial download of the metrics may take a while.