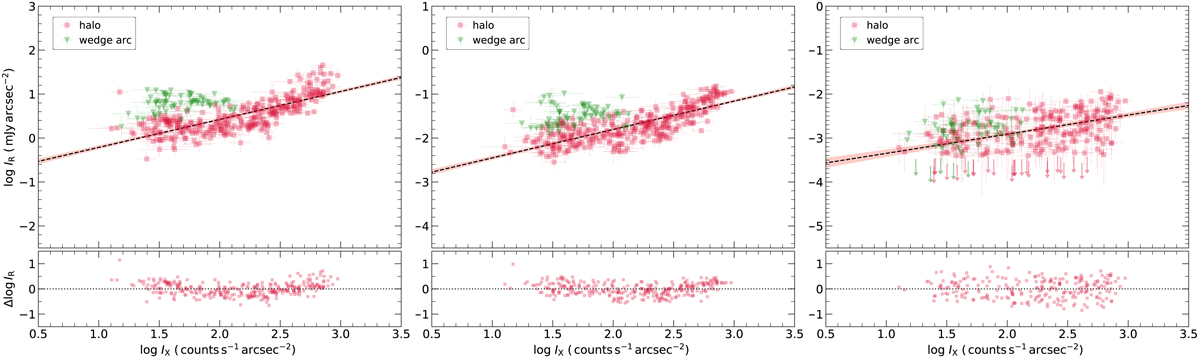
Fig. 8.
Download original image
Radio versus X-ray surface brightness correlation for the halo in Abell 2256 at 144 MHz (Left), 675 MHz (Middle), and 1.5 GHz (Right). The surface brightness is extracted from square-shaped boxes (width of 23 kpc) and in a “common region” visible across all three frequencies. The X-ray surface brightness is extracted from the XMM-Newton (0.5−2 keV band) image smoothed with a Gaussian FWHM of 6″ to have a good signal-to-noise ratio in the fainter outer regions. The radio surface brightness is extracted from radio maps at 20″ resolution. The Linmix best-fit relations for the halo data points are depicted as black dashed lines. Squared-shape boxes represent cells where both the radio and X-ray surface brightness is greater than 3σ. The 2σ upper limits are indicated by arrows. The lower panel shows the residuals of log IR and log IX with respect to the Linmix best fit line for the halo region only. Green data points are extracted from the wedge arc.
Current usage metrics show cumulative count of Article Views (full-text article views including HTML views, PDF and ePub downloads, according to the available data) and Abstracts Views on Vision4Press platform.
Data correspond to usage on the plateform after 2015. The current usage metrics is available 48-96 hours after online publication and is updated daily on week days.
Initial download of the metrics may take a while.