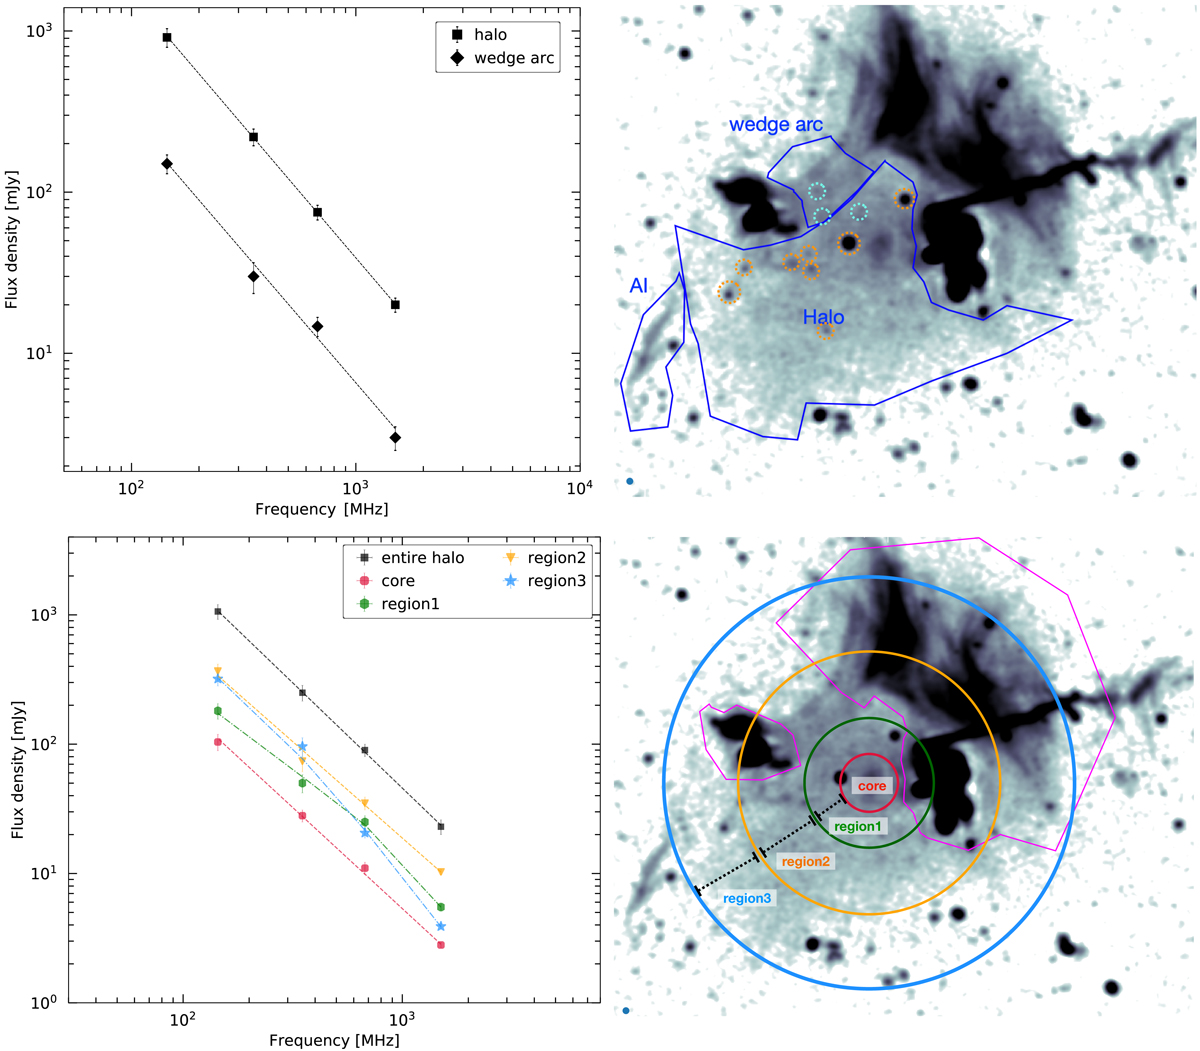
Fig. 5.
Download original image
Integrated spectrum of the radio halo and the wedge arc between 144 MHz and 1.5 GHz (top-left). Dashed lines show the fitted power law. The overall spectrum of the halo follows a single power law and has an ultra-steep spectral index of −1.63 ± 0.03. The halo subregions spectra, showing different spectral indices (bottom-left). Dashed lines show the fitted power law and dot-dashed fitted with curved spectra. LOFAR 144 MHz image overlaid with regions used for extracting flux densities of the halo, wedged arc and source AI (top-right). Flux density contributions from compact sources (shown with dashed circles) were manually subtracted from the total halo flux density. Cyan circles denote compact sources that are detected in the uGMRT and VLA images. The halo subregions: core is the innermost part and region3 the outermost one (bottom-right). These regions are used for extracting the flux densities and the radio and X-ray surface brightness in the halo subregions. Magenta polygons depict masked regions, that is not included for measuring the halo flux densities.
Current usage metrics show cumulative count of Article Views (full-text article views including HTML views, PDF and ePub downloads, according to the available data) and Abstracts Views on Vision4Press platform.
Data correspond to usage on the plateform after 2015. The current usage metrics is available 48-96 hours after online publication and is updated daily on week days.
Initial download of the metrics may take a while.