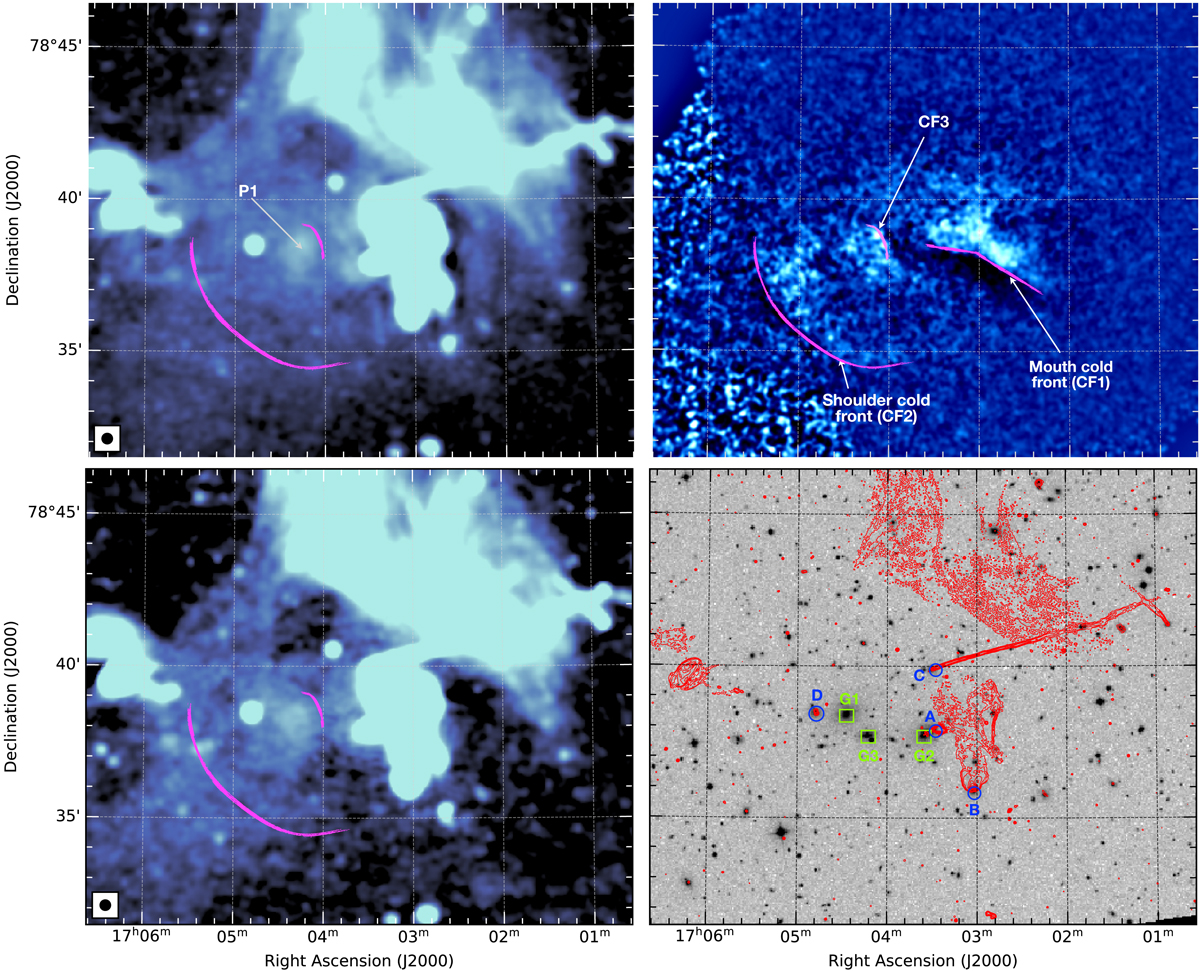
Fig. 4.
Download original image
LOFAR 144 MHz (top-left) and GMRT 350 MHz (bottom-left) image at 20″ resolution. To compare radio morphologies at these two frequencies, the colors in both images were scaled manually. Unsharp-masked Chandra 0.5−2.0 keV image of the cluster A2256 created by subtracting images convolved with Gaussians with σ1 (4″) and σ2 (40″) and dividing by the sum of the two (top-right). The image displays the sharp edges in the X-ray surface brightness image. The labeling of cold fronts (mouth and shoulder) is done following Sun et al. (2002). The comparison of both images reveal that the peak P1 in the radio surface brightness within the main component is confined by the innermost cold front CF1. DSS image overlaid with a high resolution 675 MHz radio contours (bottom-right). Green square boxes and labels mark the bright cluster galaxies in the halo. Blue circles and labels denote the position of known radio galaxies.
Current usage metrics show cumulative count of Article Views (full-text article views including HTML views, PDF and ePub downloads, according to the available data) and Abstracts Views on Vision4Press platform.
Data correspond to usage on the plateform after 2015. The current usage metrics is available 48-96 hours after online publication and is updated daily on week days.
Initial download of the metrics may take a while.