Fig. 2.

Download original image
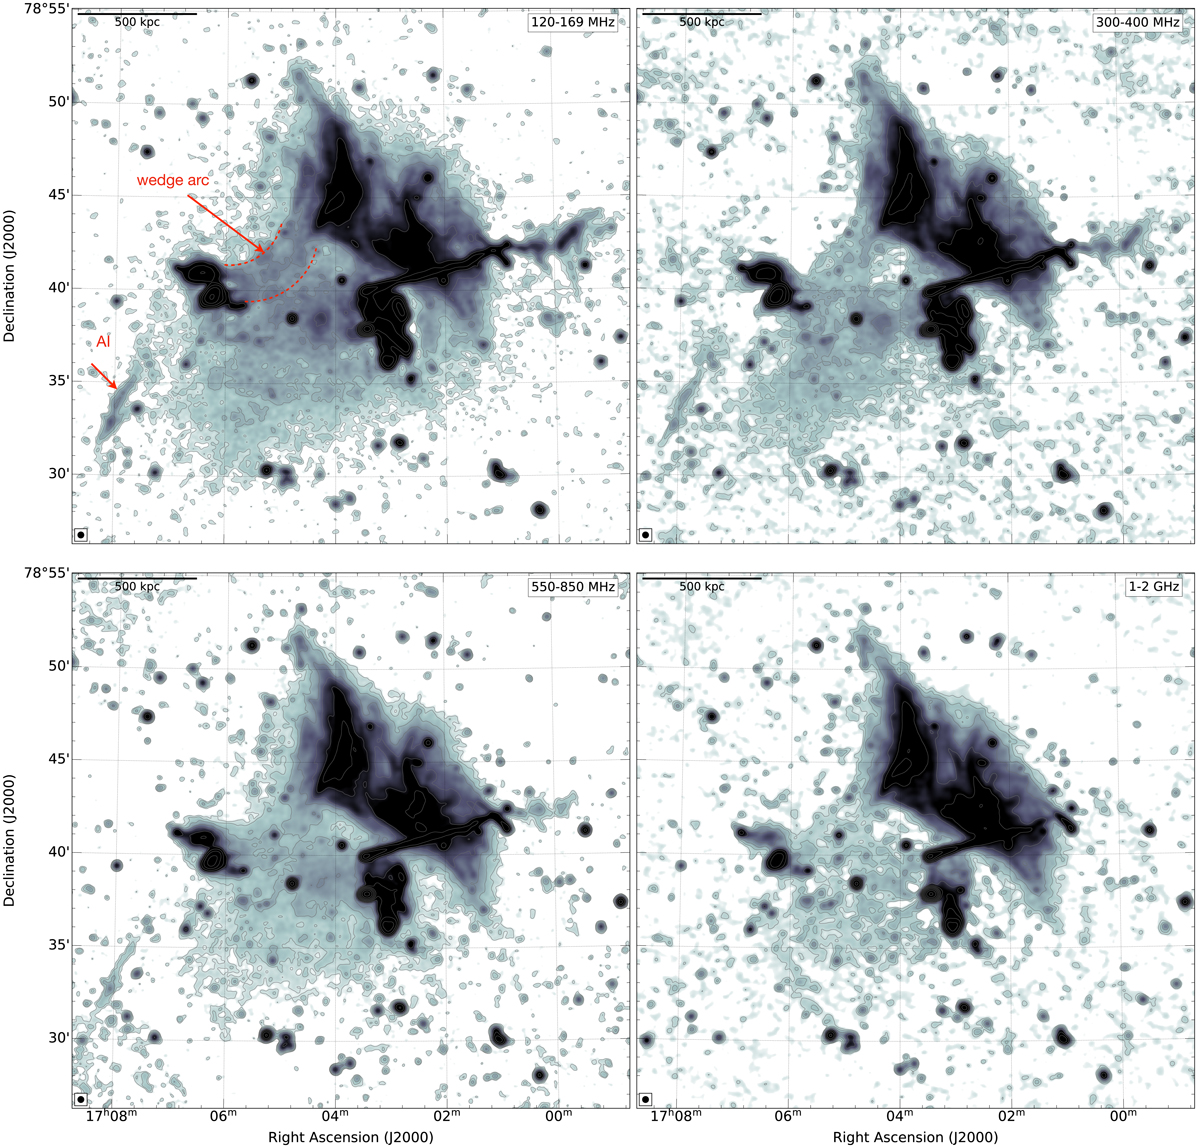
Low resolution LOFAR 144 MHz (Osinga et al. in prep), uGMRT (300–950 MHz), and VLA L-band images of Abell 2256 in square root scale. All images are created at a common 20″ resolution. The radio surface brightness unit is mJy beam−1. The beam size is indicated in the bottom left corner of each image. Contour levels are drawn at [1, 2, 4, 8, …] × 3.0 σrms, where σ144 MHz, rms = 180μJy beam−1, σ350 MHz, rms = 44μJy beam−1, σ675 MHz, rms = 18μJy beam−1 and σ1.5 GHz, rms = 10μJy beam−1. These images highlights the morphology of the halo emission with observing frequency and show that the halo is much more extended toward low frequencies. There are two other distinct features: an arc-shaped wedge to the east (show within red dotted curves) and source AI to the southwest.
Current usage metrics show cumulative count of Article Views (full-text article views including HTML views, PDF and ePub downloads, according to the available data) and Abstracts Views on Vision4Press platform.
Data correspond to usage on the plateform after 2015. The current usage metrics is available 48-96 hours after online publication and is updated daily on week days.
Initial download of the metrics may take a while.


