Open Access
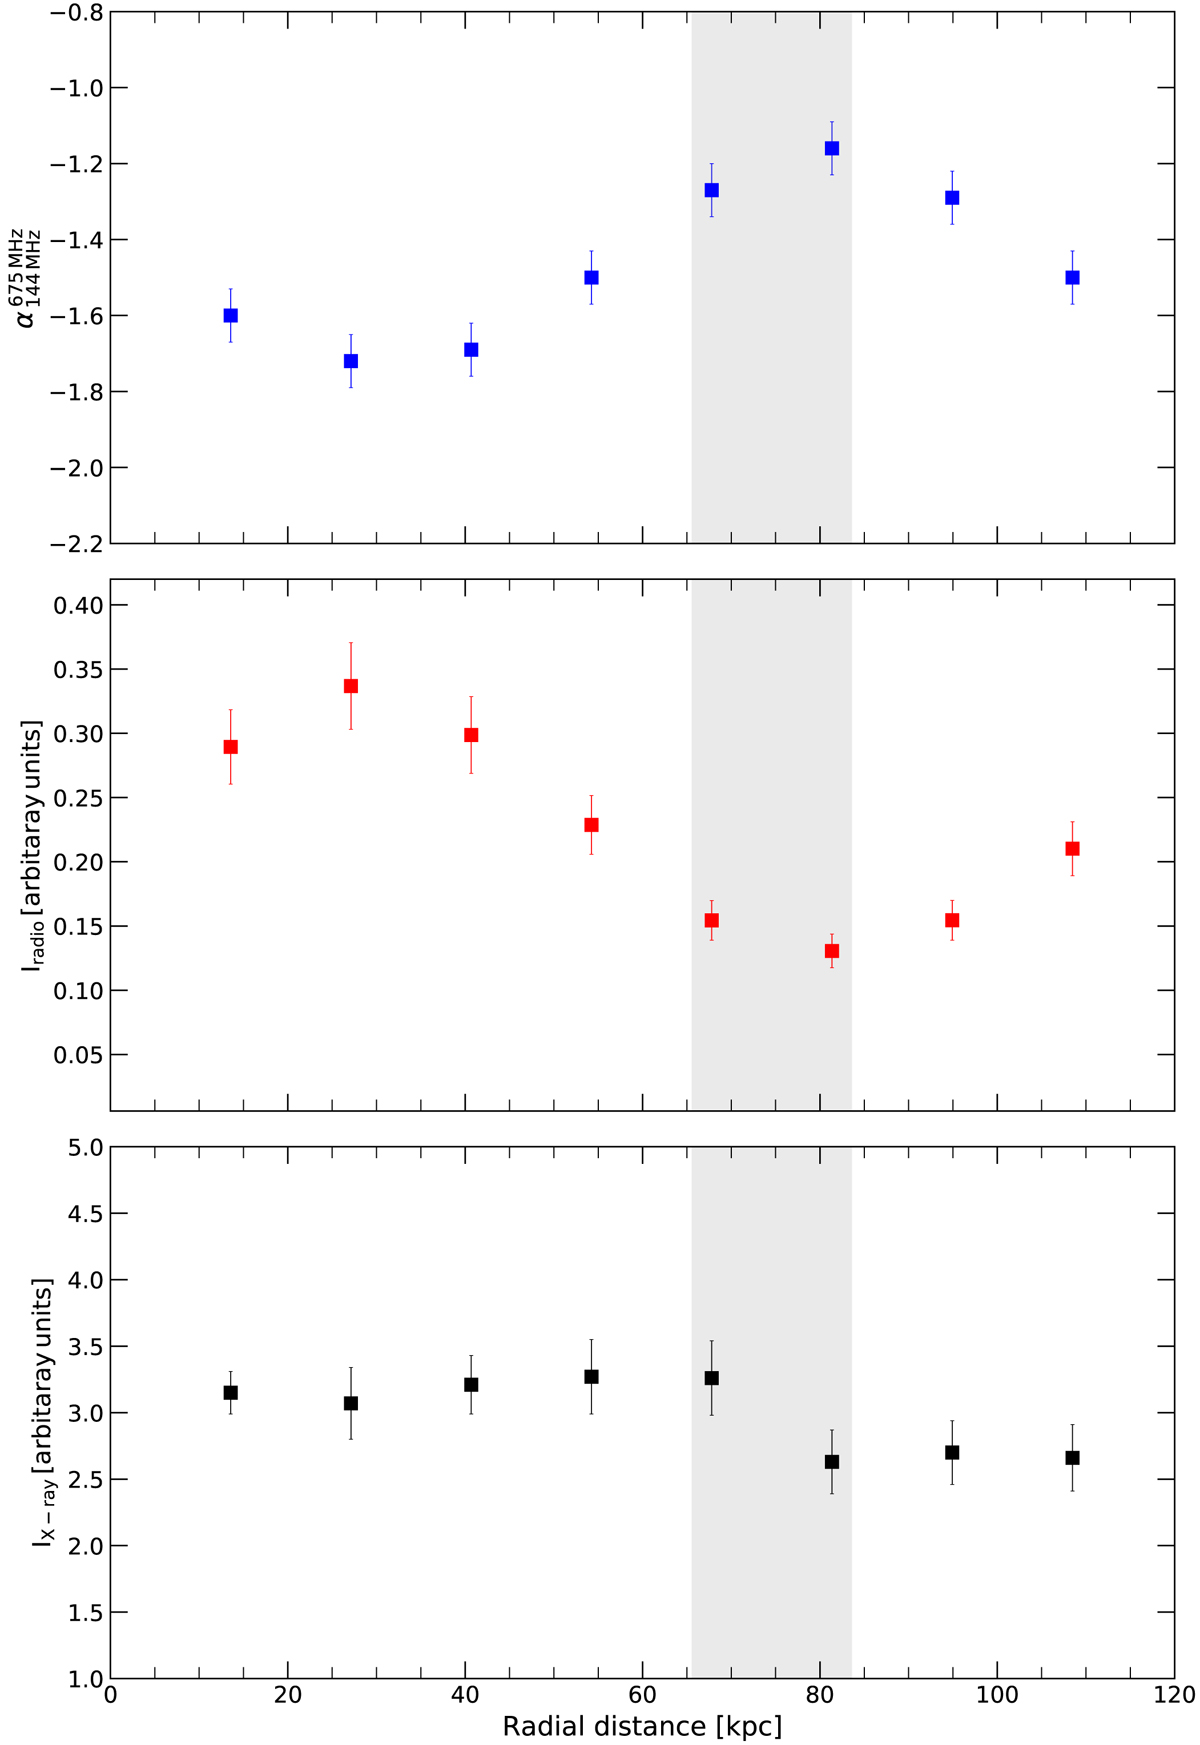
Fig. 14.
Download original image
Spectral index (top), radio (middle) and X-ray (bottom) surface brightness profiles at the cold front CF3 (shown with gray shaded region). The width of each annulus is 12″. The error bars represent both statistical and flux density scale errors. Both radio and X-ray profiles show a jump at the cold front.
Current usage metrics show cumulative count of Article Views (full-text article views including HTML views, PDF and ePub downloads, according to the available data) and Abstracts Views on Vision4Press platform.
Data correspond to usage on the plateform after 2015. The current usage metrics is available 48-96 hours after online publication and is updated daily on week days.
Initial download of the metrics may take a while.