Fig. 13.
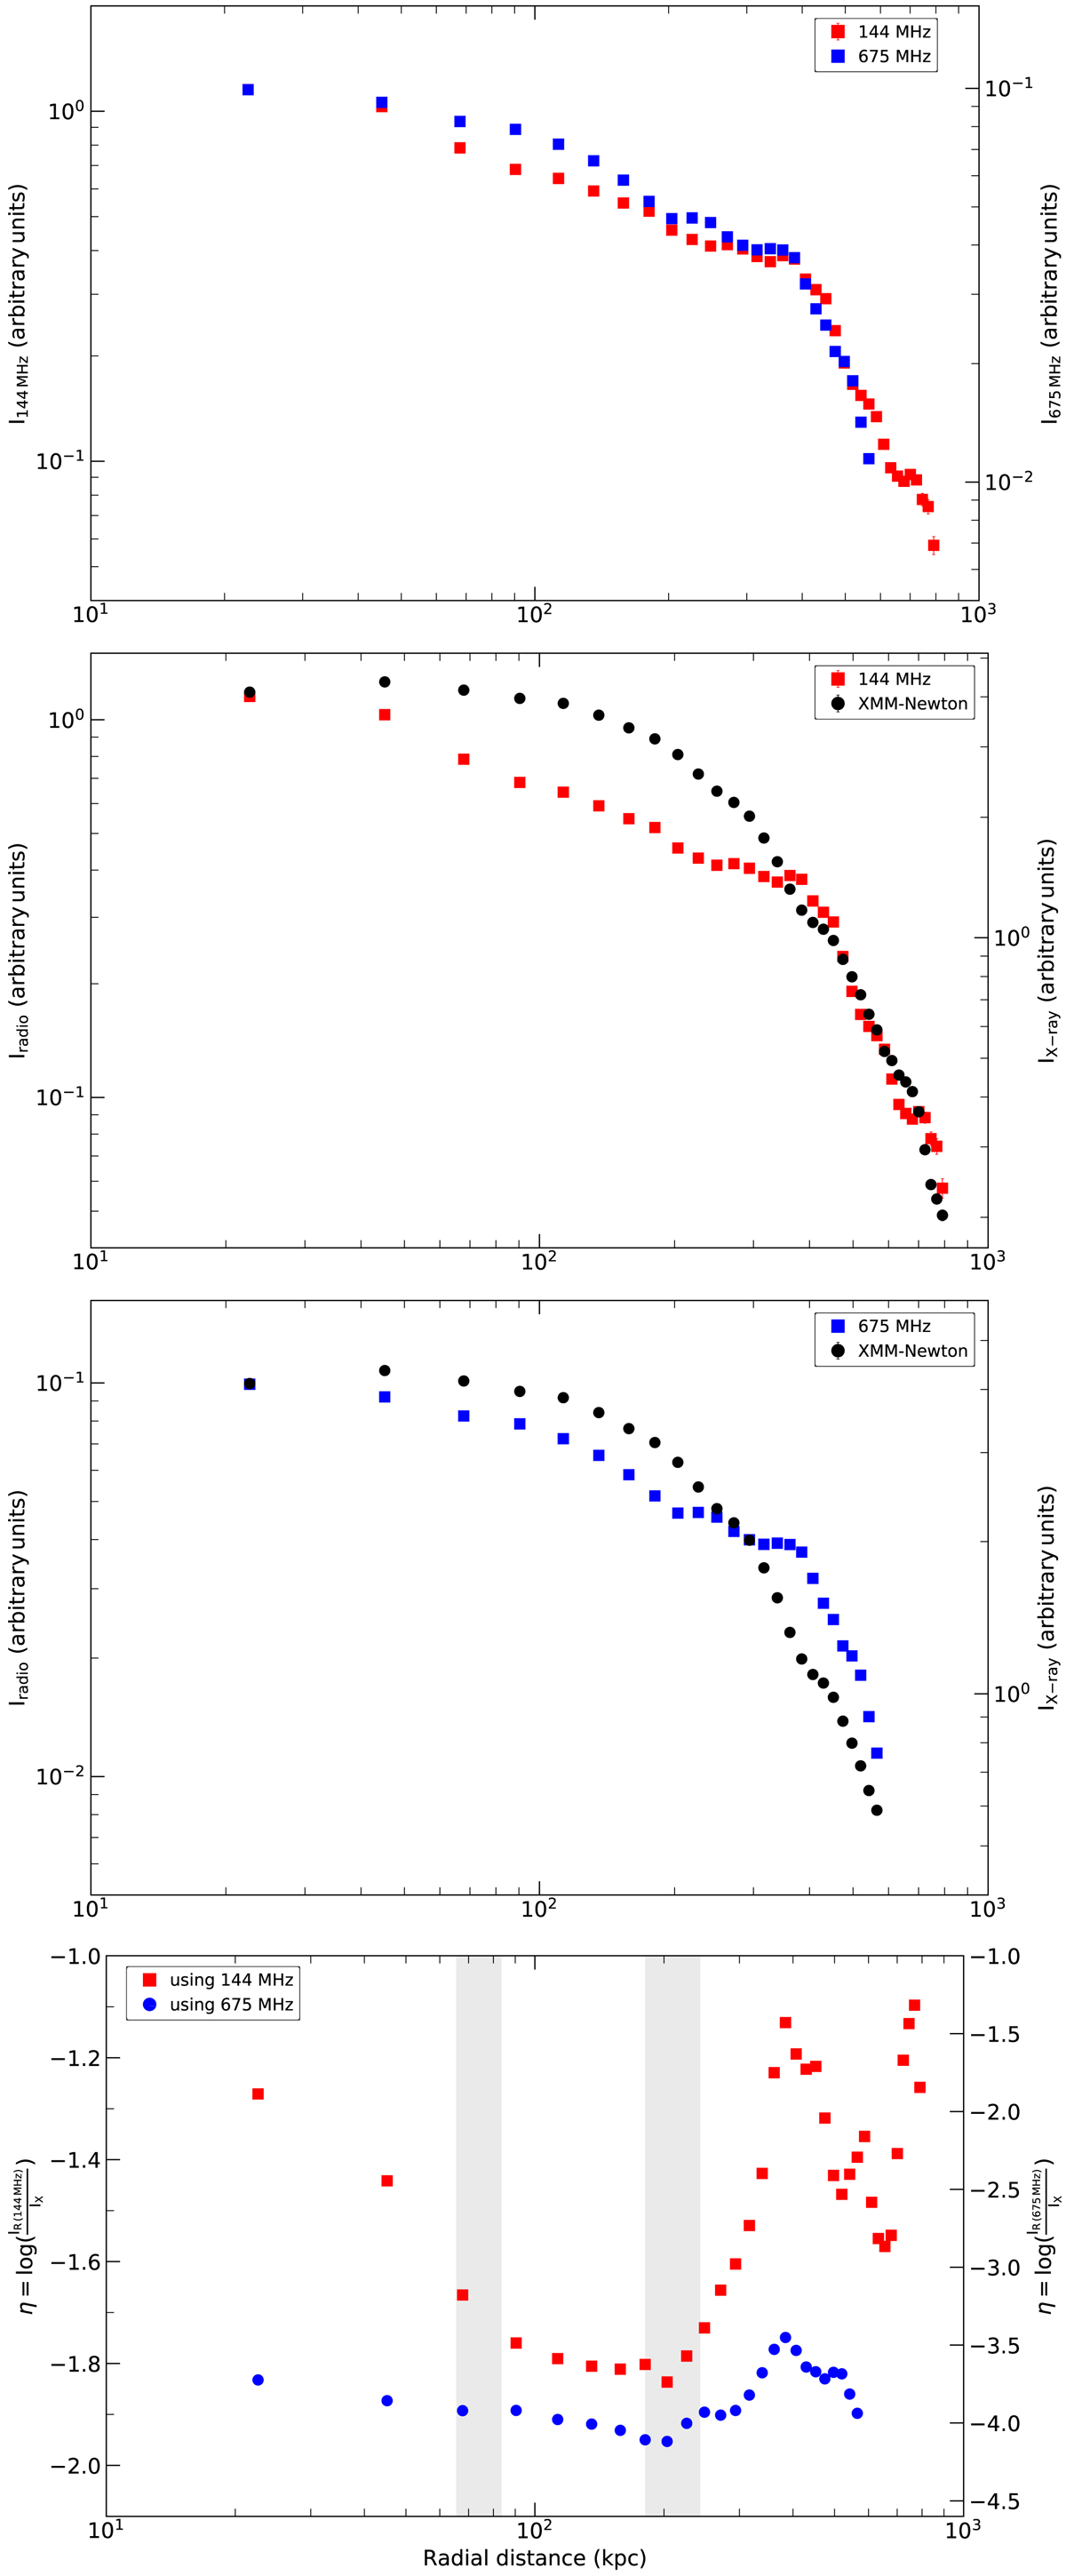
Download original image
Radial profiles extracted from radio and X-ray maps. The 144 MHz and 675 MHz profiles seem more or less similar (Top panel). However, the radio profiles seem steeper than the X-ray (Middle panels). The bars represent only statistical errors and do not appear because they are smaller than the data points. The η profile (Bottom panel) extracted by dividing radio (144 MHz and 675 MHz) and X-ray surface brightness. The gray-shaded areas show the location of cold fronts (CF3 and CF2). The region used for extracting the profiles is shown with red in Fig. 12.
Current usage metrics show cumulative count of Article Views (full-text article views including HTML views, PDF and ePub downloads, according to the available data) and Abstracts Views on Vision4Press platform.
Data correspond to usage on the plateform after 2015. The current usage metrics is available 48-96 hours after online publication and is updated daily on week days.
Initial download of the metrics may take a while.